Part 1 : The Linear Model with a Categorical IV…with THREE+ Levels
In Chapter 7, we showed how the linear model could be adapted to predict a numeric DV when the IV was a categorical variable with two levels. And guess what? When the IV has more than three levels, we can use the same linear model. Hooray! The only difference is now you have multiple levels that differ from the intercept (or “reference group”).
Let’s mix it up, and see if some good ol’ fashioned YOUTUBE VIDEOS OF A DISEMBODIED VOICE can explain this.
Video 1 : Defining the Model with the lm() function
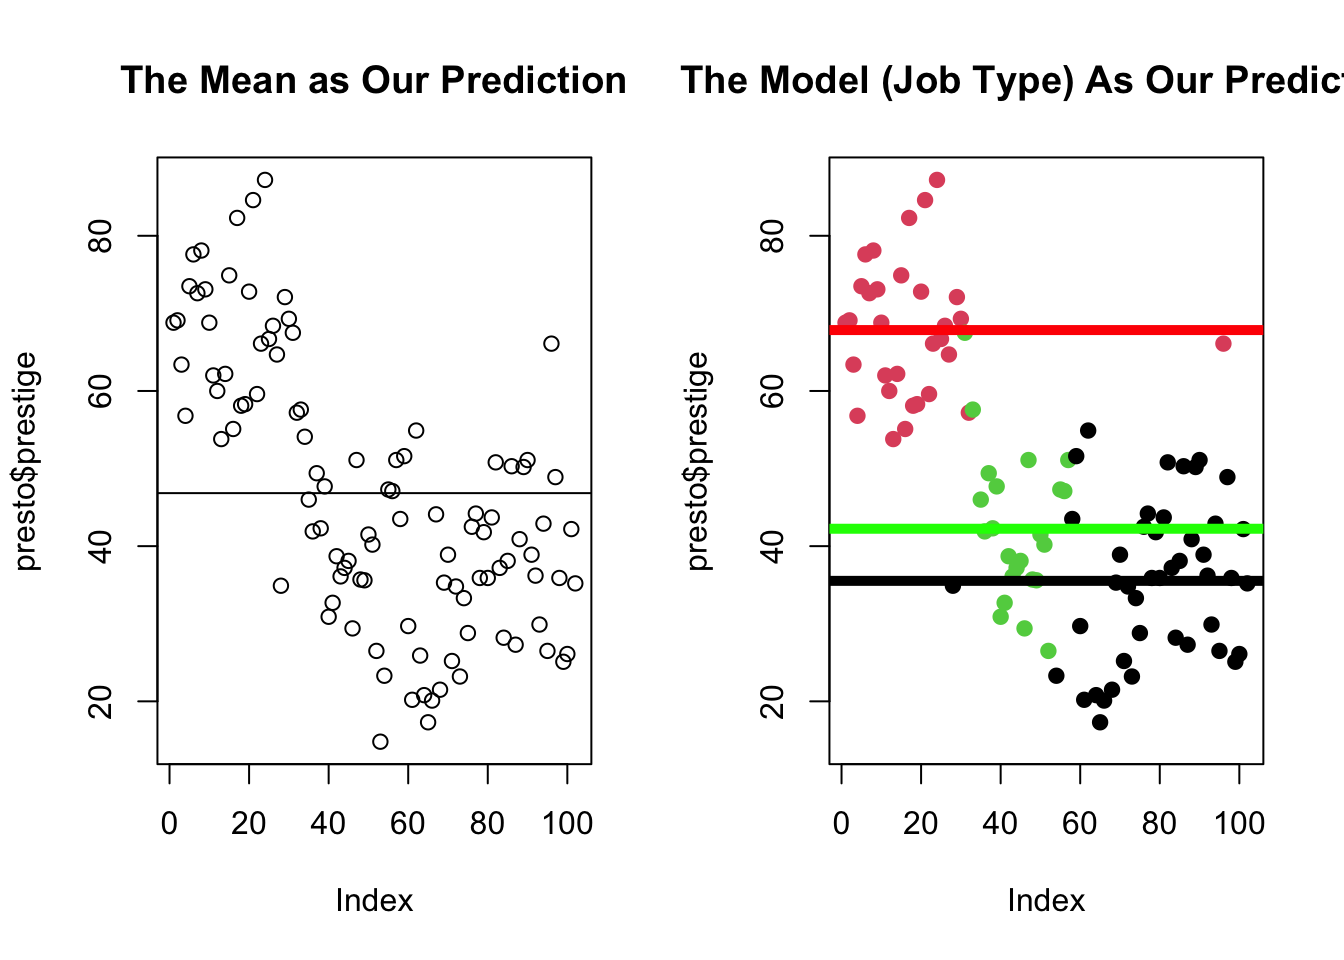
par(mfrow =c(1,2))plot(presto$prestige, main ="The Mean as Our Prediction")abline(h =mean(presto$prestige), )plot(presto$prestige, col = presto$type, pch =19, main ="The Model (Job Type) As Our Prediction")abline(h =coef(mod)[1] +coef(mod)[2], col ='red', lwd =5)abline(h =coef(mod)[1] +coef(mod)[3], col ='green', lwd =5)abline(h =coef(mod)[1], col ='black', lwd =5) # blue collar
Last chapter, we learned the “four reasons” why you might find a “pattern in the data” (another way of saying why “correlation does not equal causation”. However, scientists and psychologists often want (or need) to establish causation, and an experiment is the “gold standard” approach for how to do this.
Scientists and psychologists often want (or need) to establish causation, and an experiment is the “gold standard” approach for how to do this.
I’m guessing y’all have learned about experiments in many other classes, so won’t spend pages and pages and pages going over it again here.1
1 I’ll just spend pages going over it. Hah hah.
Here’s a supplemental chapter on experiments that reviews some key terms you should be familiar with : experimental manipulation; extraneous variables as “noise”; random assignment; placebo effects; external validity; construct validity; experimenter expectancy effects.
The Definition of Causality
The cause and effect are contiguous in space and time.
The cause must be prior to the effect. (no reverse causation)
There must be a constant union betwixt the cause and effect. (“Tis chiefly this quality, that constitutes the relation.”) (no random chance)
The same cause always produces the same effect, and the same effect never arises but from the same cause. (not “just” some third variable) [^1]
[^1] but remember, life is complex and there are often multiple causes of human behavior!
The Google Experiment
When I worked at Google as an intern for one summer2, corporate PR told a story about their “data driven approach”, where no decision was left to mere chance. Even something as simple as the color font they used could be the focus of an analytic research question.
2 well-fed; gratuitously paid; soul-drained. I was in their “People Operations” (/HR) department, helping them set up longitudinal surveys and do various other research projects on compensation, appreciation, and diversity that helped feed the corporate beast.
Then, see if you can identify the different parts of an experiment.
linear model : DV ~ IV (what was manipulated) + confound variables + error
manipulation : what were the treatment and control groups?
random assignment : how were confound variables balanced across conditions?
double-blind : did the study avoid demand characteristics & placebo effects?
generalizability : did the study have external validity? what was the effect size (R2)?
ethics : should researchers do this type of study [predict & control]
TipAnswers to Google Shade of Blue Experiment
linear model : number of ads that peopled clicked on ~ shade of blue people saw + age + location + income + education + media literacy + relevance of the ad + etc + error
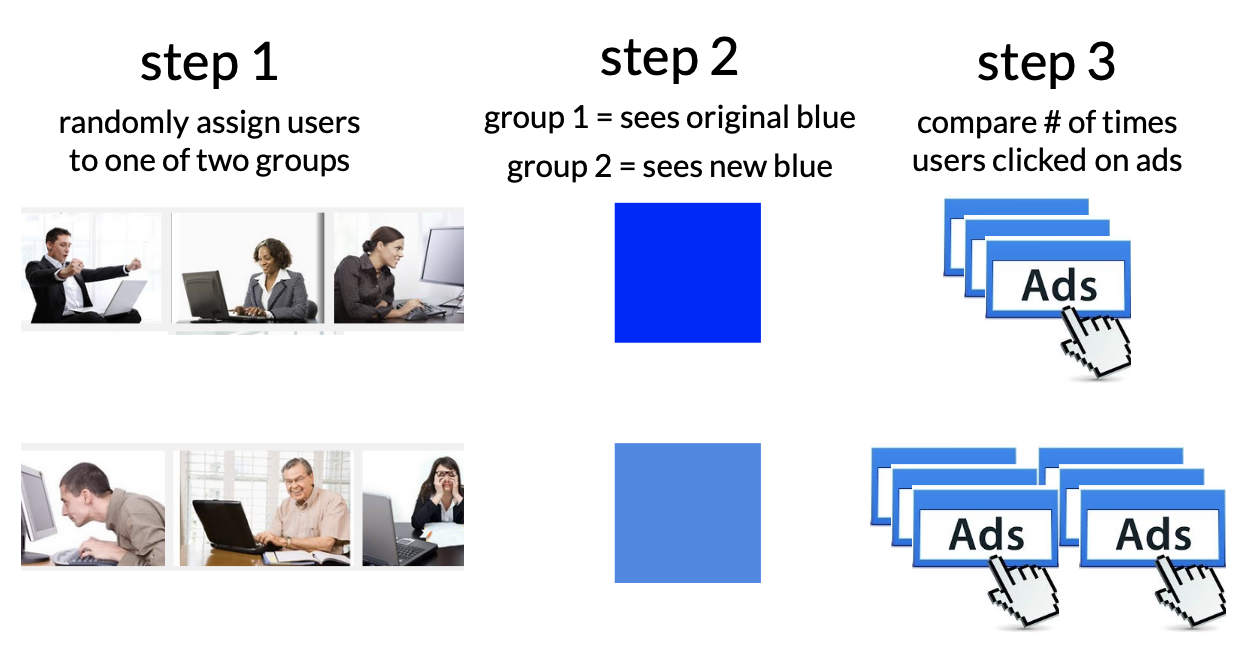
manipulation : “control” group = shade of blue (existing shade of blue); treatment group = shade of blue.
random assignment : participants were randomly assigned to see links in one shade of blue or another. because this was randomly assigned, all the other differences between people (those variables that might affect the DV, such as age or location) are “balanced out”.
double-blind : the participant didn’t know that google was manipulating the shade of blue to get them to click on ads. the website (google) doesn’t know whats going on.
generalizability : yes, high external validity! Google was changing its own website. an example of low external validity would be printing out a sheet with different shades of blue that users “click” on with their finger.
ethics : WOULD LOVE TO HEAR FROM Y’ALL : do you think it’s ethical for companies like Google to do this research???