Go into a breakout room and share your screen as you work on the check-in.
Link to Dataset
score = narcissism score (40-item scale)age = Entered as a free response. Ages below 14 have been ommited from the dataset.sex = Chosen from a drop down list (1=male, 2=female, 3=other; 0=none was chosen).
code you may need :
head (d) # check the data hist (d$ variable) # graph a numeric variable plot (d$ variable) # graph a categorical variable plot (d$ dv ~ d$ iv) # draw a scatterplot <- lm (d$ dv ~ d$ iv) # define a linear model abline (mod) # draw the model on the scatterplot coef (mod) # find the slope and intercept summary (mod)$ r.squared # report R^2
Check-In Spoilers
score = narcissism score (40-item scale)age = Entered as a free response. Ages below 14 have been ommited from the dataset.sex = Chosen from a drop down list (1=male, 2=female, 3=other; 0=none was chosen).
<- read.csv ("~/Dropbox/!WHY STATS/Chapter Datasets/Narcissism Data/narcissism_data.csv" , stringsAsFactors = T)head (d)
  score Q1 Q2 Q3 Q4 Q5 Q6 Q7 Q8 Q9 Q10 Q11 Q12 Q13 Q14 Q15 Q16 Q17 Q18 Q19 Q20
1    18  2  2  2  2  1  2  1  2  2   2   1   1   2   1   1   1   2   1   1   1
2     6  2  2  2  1  2  2  1  2  1   1   2   2   2   1   2   2   1   1   2   1
3    27  1  2  2  1  2  1  2  1  2   2   2   1   1   1   1   1   2   2   1   1
4    29  1  1  2  2  2  1  2  1  1   2   1   1   1   1   1   1   2   2   1   2
5     6  1  2  1  1  1  2  1  2  1   2   2   2   2   2   1   1   1   1   1   1
6    19  1  2  2  1  2  1  1  1  2   2   1   1   1   2   1   1   1   1   1   1
  Q21 Q22 Q23 Q24 Q25 Q26 Q27 Q28 Q29 Q30 Q31 Q32 Q33 Q34 Q35 Q36 Q37 Q38 Q39
1   1   1   1   2   2   2   1   2   2   2   1   2   1   1   1   2   2   2   1
2   2   2   1   2   2   2   2   1   2   2   2   1   2   2   1   2   2   2   2
3   2   2   2   2   1   2   1   1   2   1   2   2   1   1   2   1   1   2   1
4   1   1   1   2   1   2   1   2   2   1   1   2   1   1   2   1   2   2   1
5   1   2   1   2   2   1   2   1   2   2   2   1   2   2   1   2   2   2   0
6   1   1   1   1   2   1   1   1   2   1   1   2   1   2   1   1   2   2   2
  Q40 elapse gender age
1   2    211      1  50
2   1    149      1  40
3   2    168      1  28
4   1    230      1  37
5   1    389      1  50
6   2    361      1  27
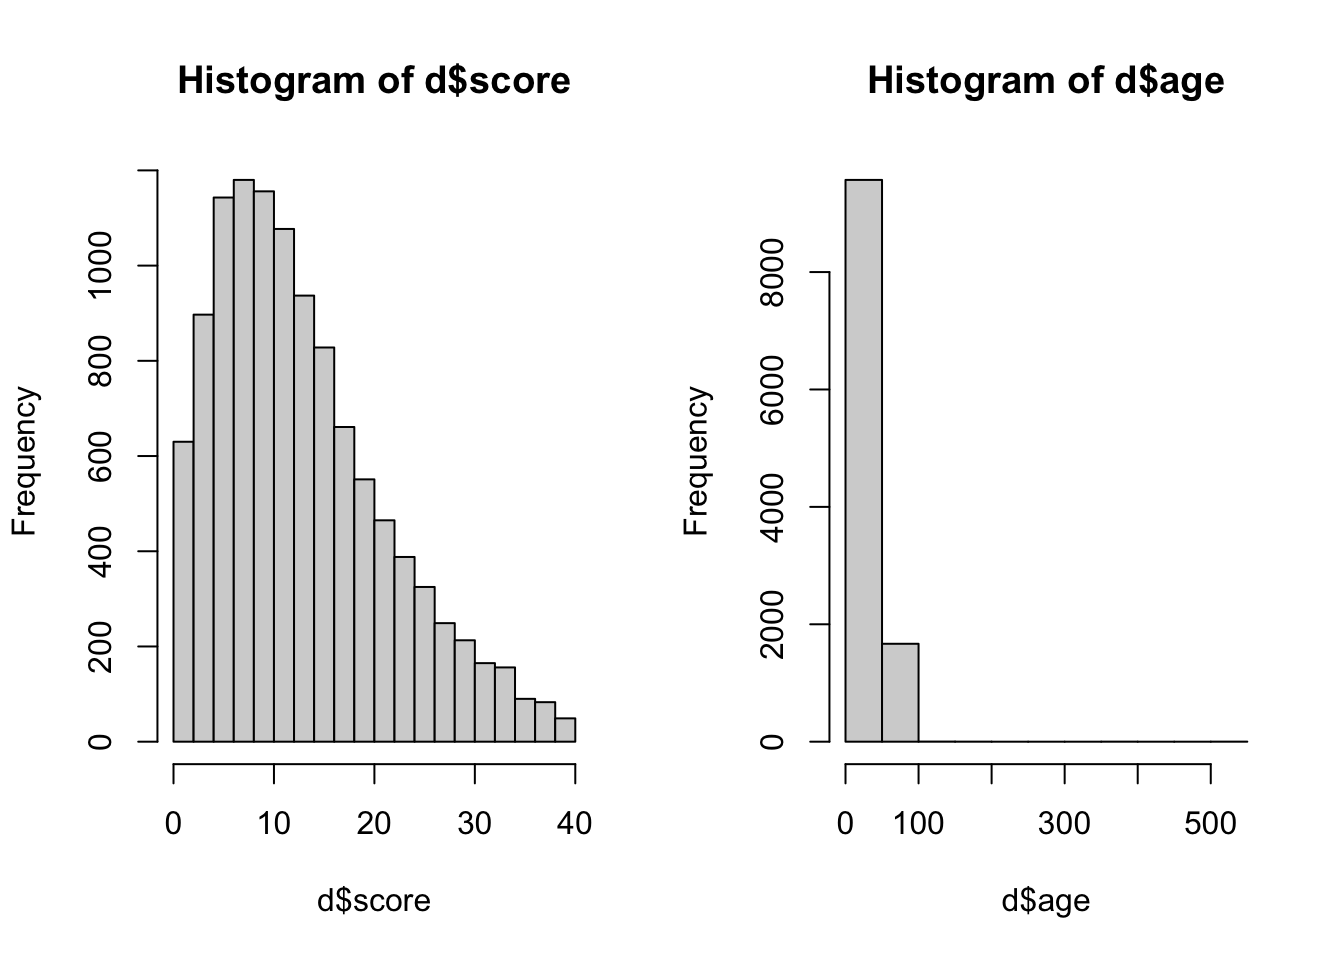
par (mfrow = c (1 ,2 ))hist (d$ score)hist (d$ age)
$ age[d$ age > 100 | d$ age < 14 ] # outliers
 [1] 366  13 148  13  12 117  13 509  13  13  13  12  13  13 190  13  13  13  11
[20]  13  13  13  13   0  13   0   0  13  13   0  13  13   0   6   0  13   0  13
[39]   0   0  13   0  13  10  13   0   0  13  13   2
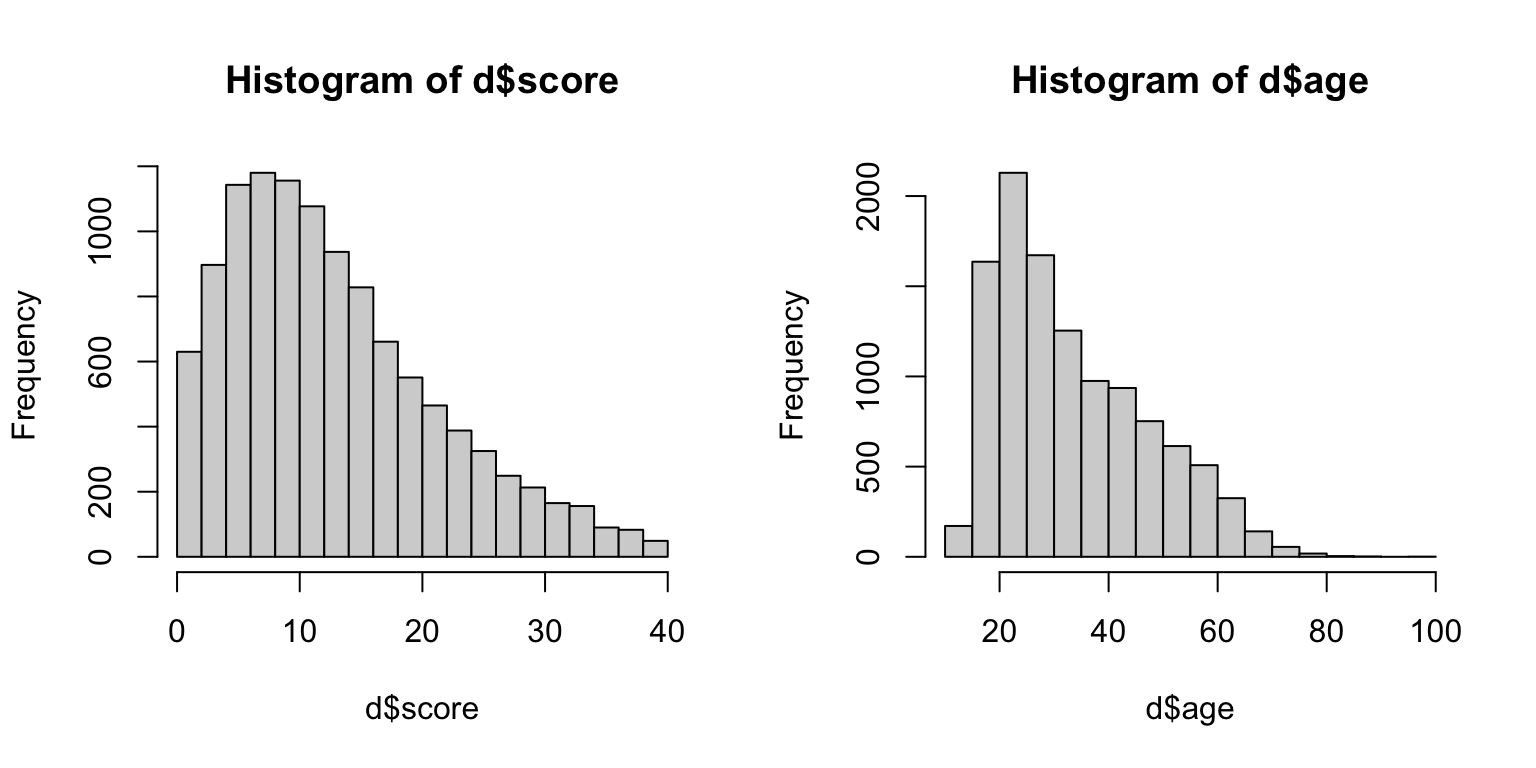
$ age[d$ age > 100 | d$ age < 14 ] <- NA # they gone. par (mfrow = c (1 ,2 ))hist (d$ score)hist (d$ age)
Defining the Model
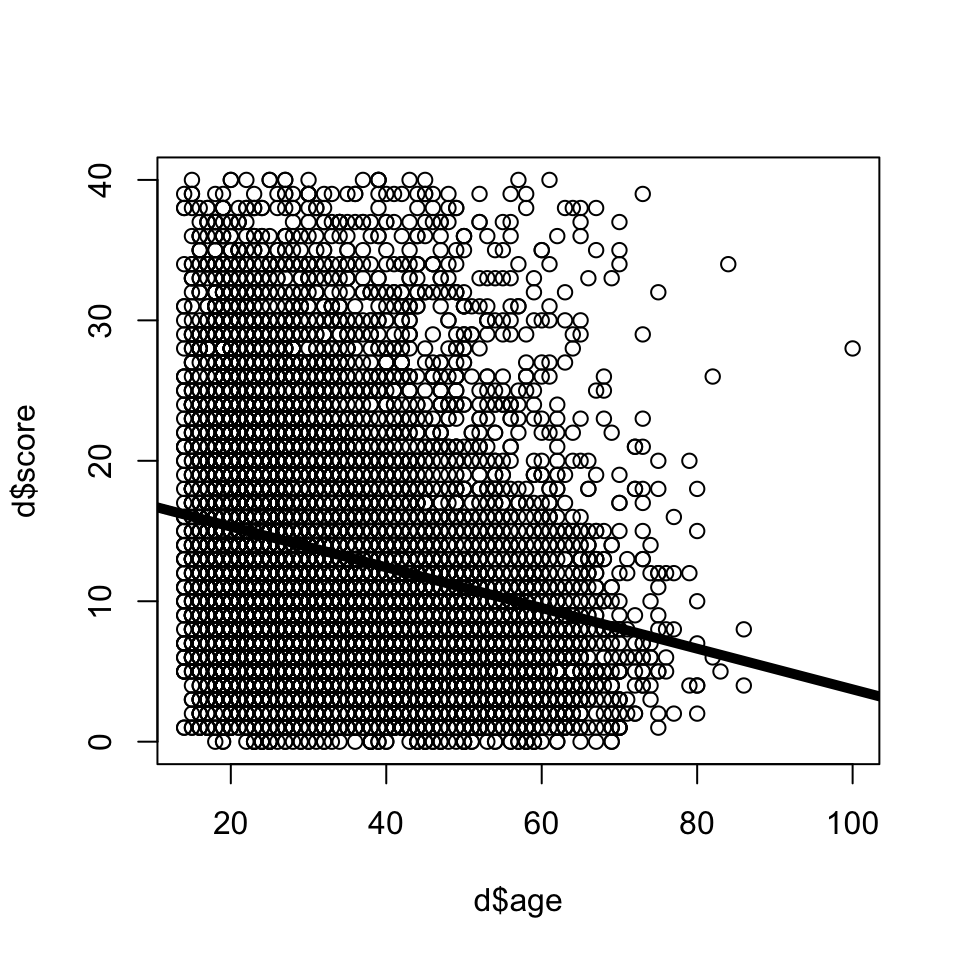
plot (d$ score ~ d$ age)<- lm (d$ score ~ d$ age)abline (mod, lwd = 5 )
Interpreting The Model
(Intercept)       d$age
 18.2149771  -0.1448936
Professor Notes Go Here.
Defining the Model
plot (scale (d$ score) ~ scale (d$ age))<- lm (scale (d$ score) ~ scale (d$ age))abline (modZ, lwd = 5 )
Interpreting The Model
 (Intercept) scale(d$age)
        0.00        -0.23
Professor Notes Go Here.
Question : Is there a relationship between gender and narcissism?
See Prof. R script and demo.