CHECK-IN : Linear Model Prep

d <- read.csv("~/Dropbox/!WHY STATS/Chapter Datasets/Our World in Happy Data/DATASET_happy_data.csv", stringsAsFactors = T)
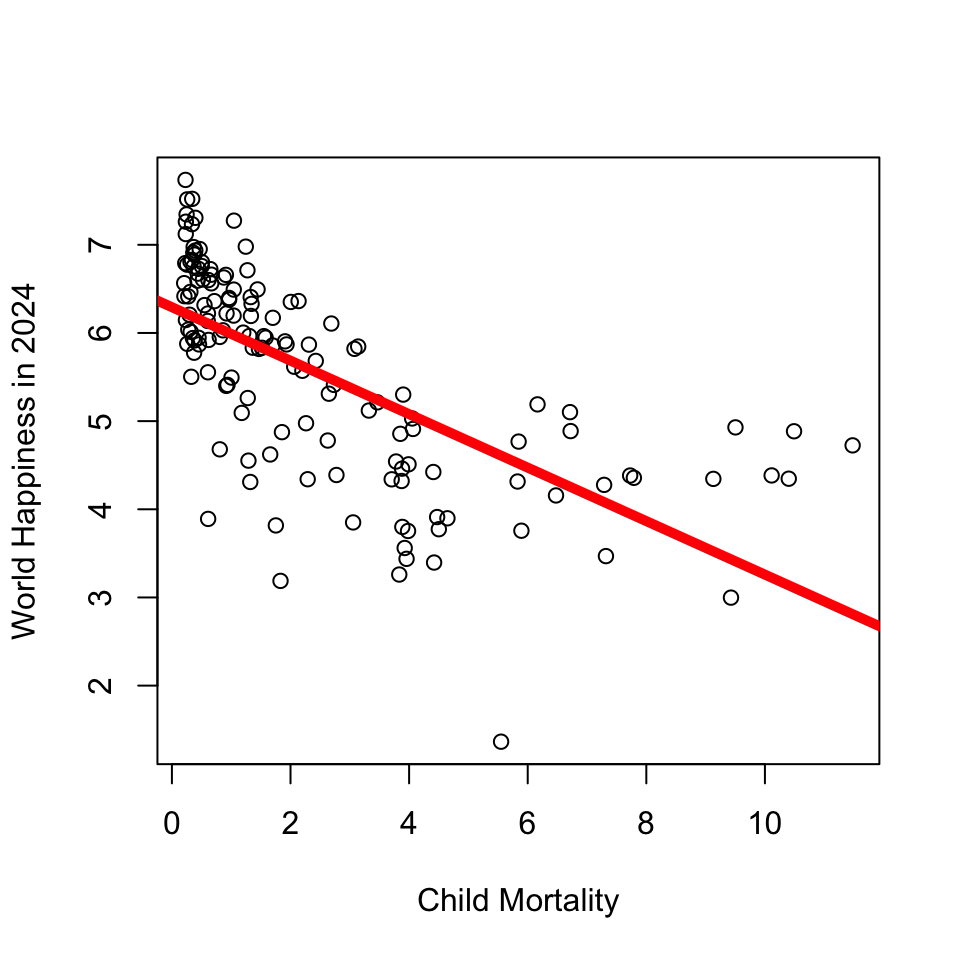
plot(d$SWLS_24 ~ d$Child.Mortality, xlab = "Child Mortality", ylab = "World Happiness in 2024")
mod <- lm(d$SWLS_24 ~ d$Child.Mortality)
abline(mod, lwd = 5, col = 'red')

knitr::kable(c(round(coef(mod), 2),
                   RSQUARED = round(summary(mod)$r.squared, 2)), col.names = "Linear Model")
Linear Model
(Intercept) 6.29
d$Child.Mortality -0.30
RSQUARED 0.45

Steps for a Linear Model (in R)

  • Choose a dataset
  • Identify the variables (graph and make sure there are no outliers.)
  • Graph the relationship between the two variables
  • Define the model
  • Add the model to the scatterplot
  • Interpret the statistics : intercept, slope, and \(R^2\)

BREAK TIME : MEET BACK AT _____________

Quarto : Why are we learning this?

  • An authentic skill (professor uses)

    • Saves trouble of screenshotting : integrates code and text.
    • some GSIs are introducing it :)
  • WARNING : professor still gets frustrated when using quarto. If you are feeling dread / maxxed out, then just use an Rscript + screenshot method. Okay?

Quarto : From Source –> Render

  • What looks different about our R Script? What looks the same (or similar??)