Check-In : Review Time!
- Use the MINI dataset to answer these questions.
- Name it d to follow along with professor code.
Check-In Review
Follow along with professor’s R Script for this week.
- The R Stuff : graphs, descriptive statistics (standard deviation), and outliers?!
- The Brain Stuff : “normal” distributions.
- Questions, Concerns, Comments? What feels hard or confusing? A moment of pause.
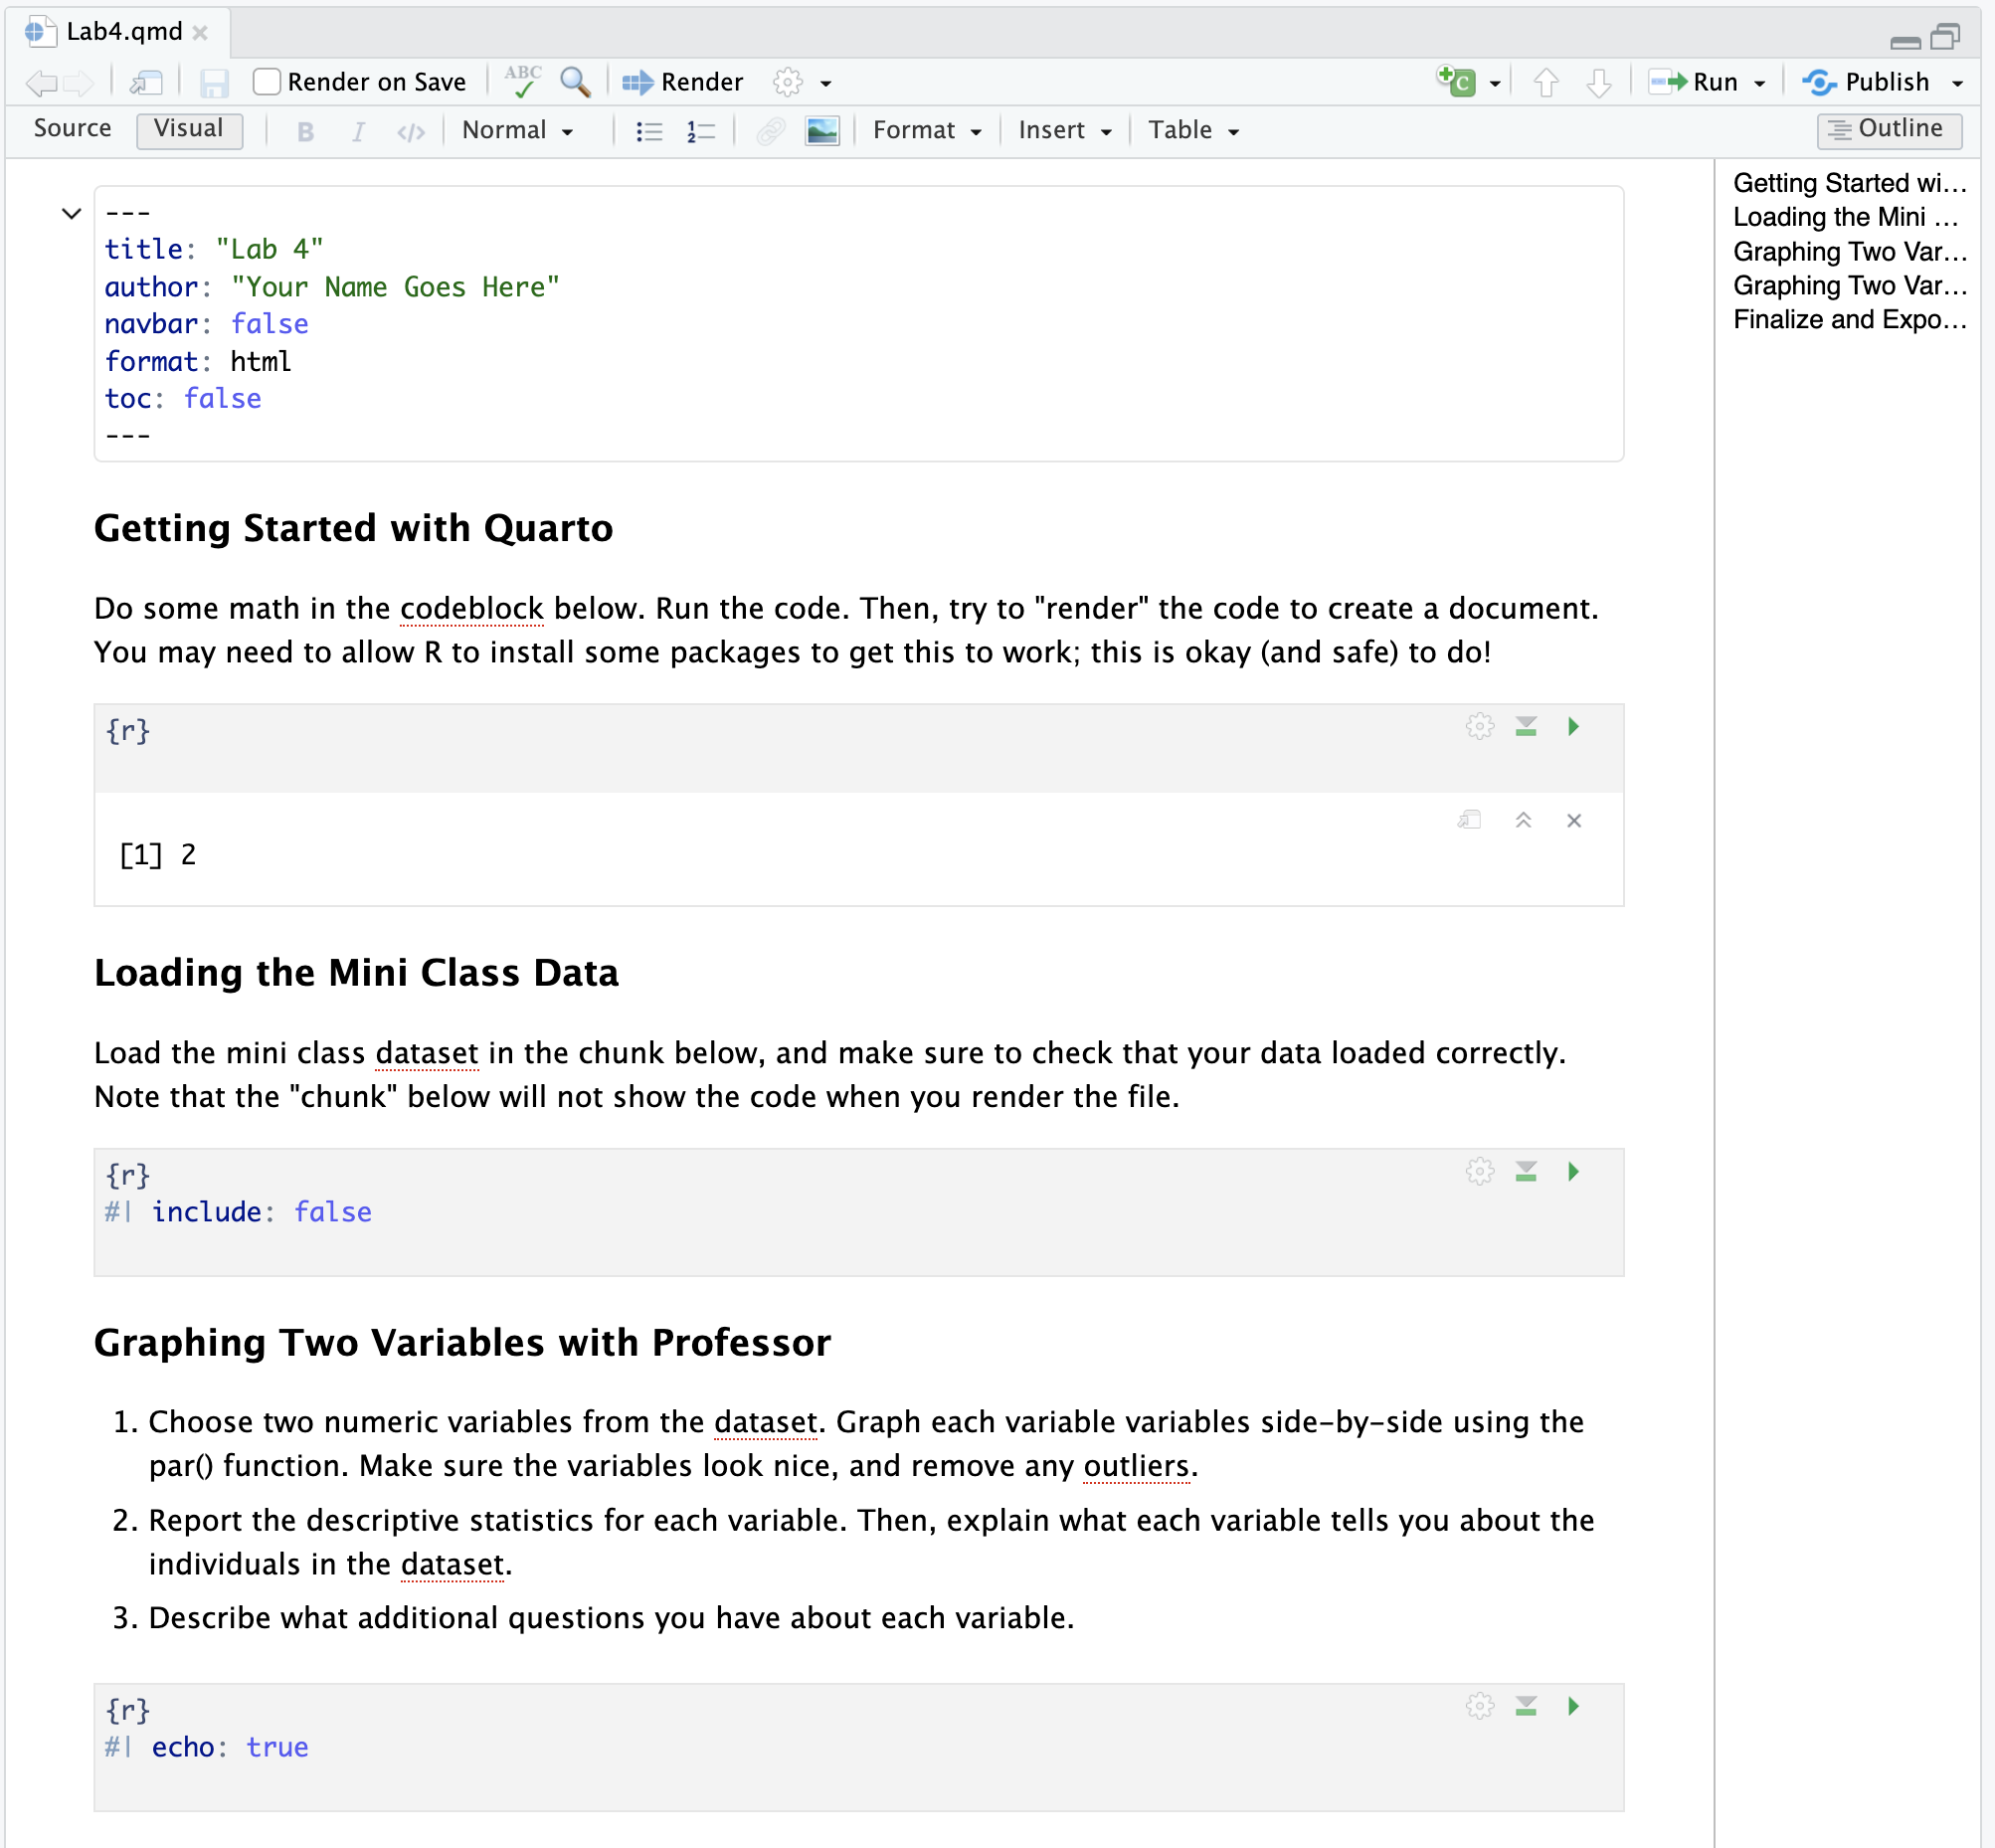
Lab 4. Continued Practice
- Choose two numeric variables from the dataset. Graph each variable variables side-by-side using the par() function. Make sure the variables look nice, and remove any outliers.
- Report the descriptive statistics for each variable. Then, explain what each variable tells you about the individuals in the dataset.
- Describe what additional questions you have about each variable.
Quarto : Why are we learning this?
It’s a Fancy RScript :
An authentic skill : professor (and others) use because it saves trouble of screenshotting by integrating code and text together in one document.
WARNING : professor still gets frustrated when using quarto. If you are feeling dread / maxxed out, then just use an Rscript + screenshot method. Okay?
Quarto : From Source –> Render
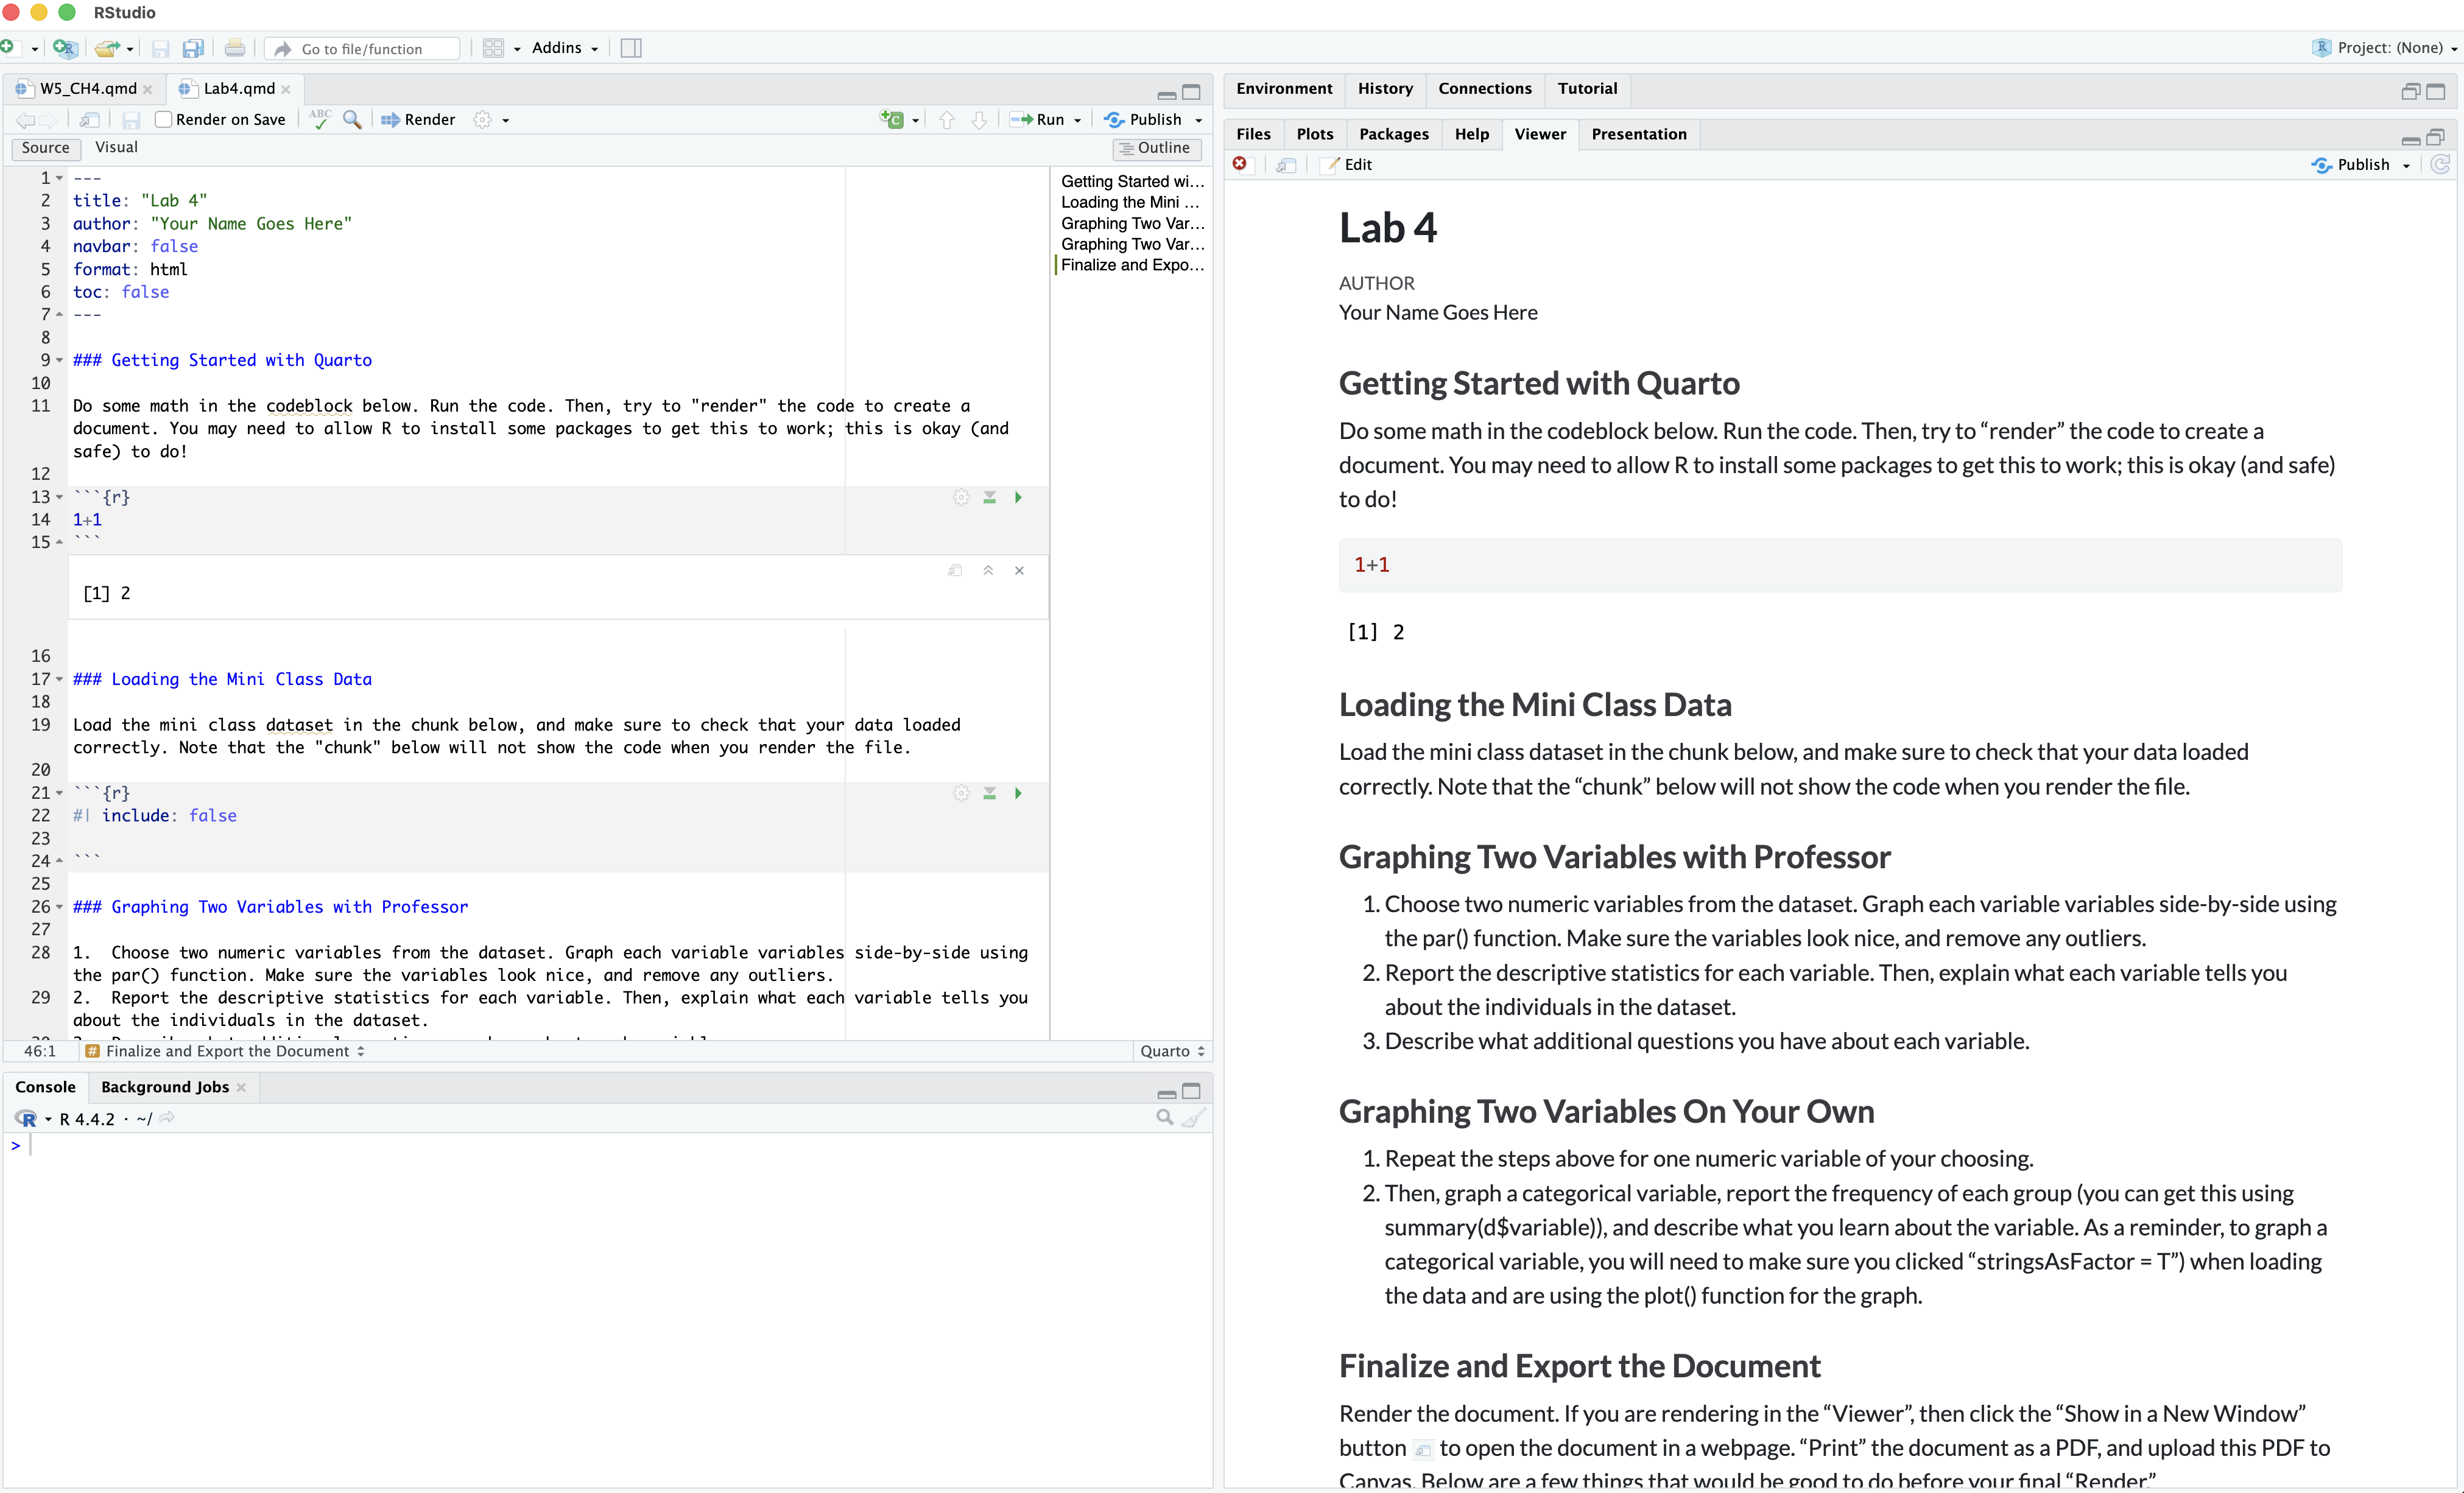
Quarto : The Visual Editor