Lab 7
Question 1. Anchoring Dataset.
Use the anchoring dataset to predict cat speeds, tree heights, and meat consumption from the experimental condition that people were in.
- Load the data, and check to make sure it loaded correctly.
- Graph your variables - make sure there are no errors or outliers.
- Define a linear model for each DV. Make sure to include a graph or each model, report the intercept, slope, and R2 for each model. What do these statistics tell you?
- Read the chapter notes on experiments, and apply these ideas to the anchoring study. How was this an example of an experiment (e.g., what were the conditions; was it randomly assigned; etc.)
- Conclude - what do these models tell us about the phenomenon of anchoring? How we might use this knowledge?
Question 2. Your Final Project Dataset in R.
Finish collecting your final project data, export these data into a .csv format, do some (extra) data cleaning to make your project dataset nice and organized, and then start doing descriptive statistics for your variables.
There are videos and steps in the Final Project Description on how to do this you should watch. You will also work on this in Discussion Section!!
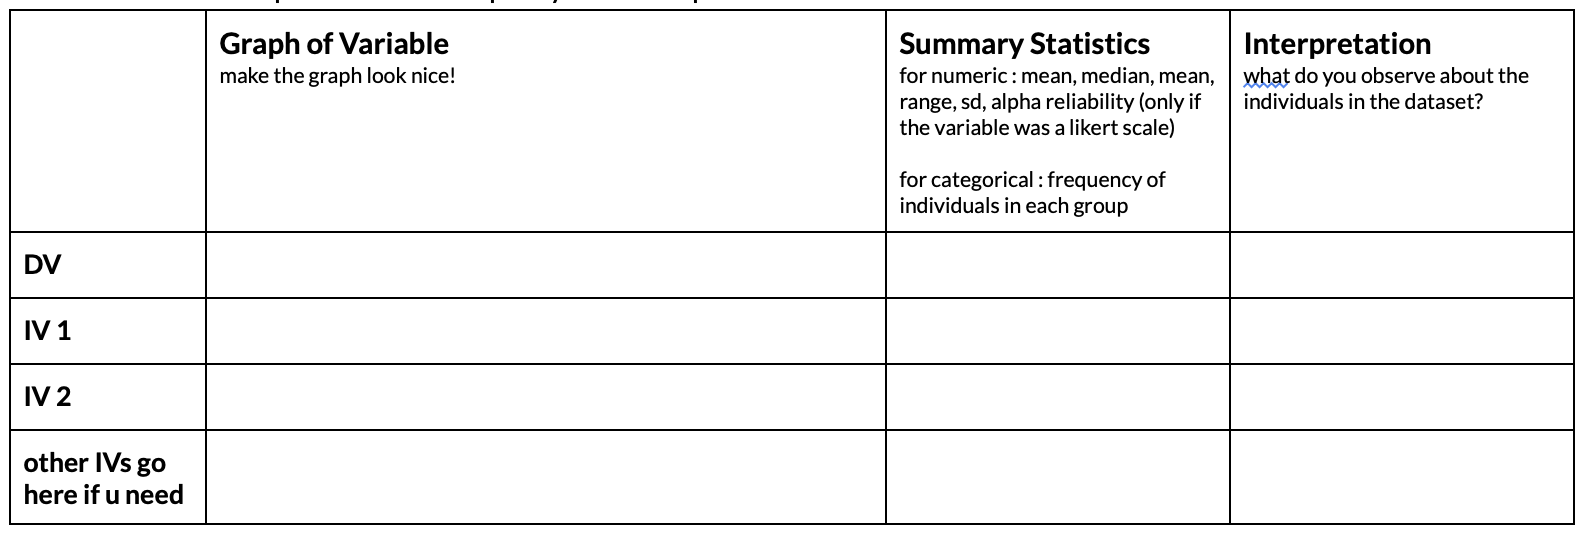
To show you’ve done this, start filling in some of the descriptive statistics for your final project in the some kind of table (see below for an example of what this could look like.)