m <- read.csv("~/Dropbox/!WHY STATS/Chapter Datasets/Covid Behavior Data/covid_behavior_data.csv", stringsAsFactors = T)
plot(m$Handwash, ylab = "Handwashing Behavior")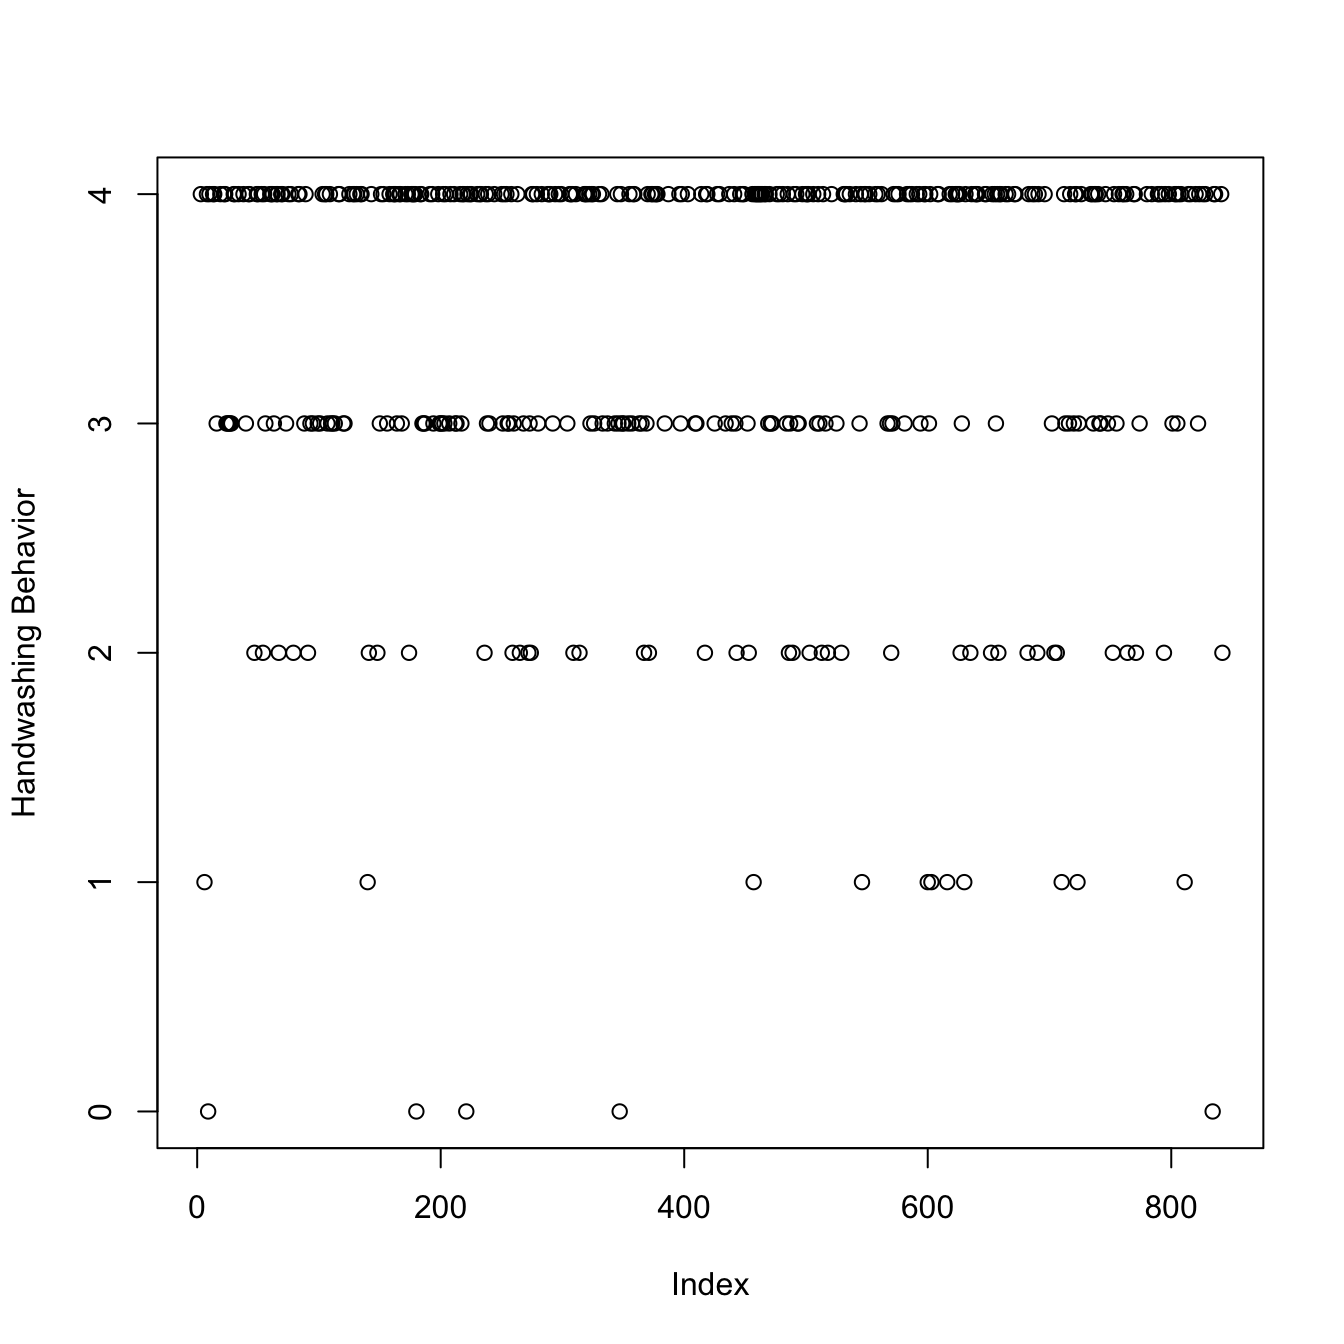
Check-In Here : tinyurl.com/dvcminidata
Agenda
8:55 - 9:10. Check-In.
9:10 - 9:40. Describing Data with Brain.
9:40 - 10:10. Describing Data with R.
10:10 - 10:20. Break Time
10:20 - 11:00. Work on Lab 3.

m <- read.csv("~/Dropbox/!WHY STATS/Chapter Datasets/Covid Behavior Data/covid_behavior_data.csv", stringsAsFactors = T)
plot(m$Handwash, ylab = "Handwashing Behavior")
plot(m$Handwash, ylab = "Handwashing Behavior")
abline(h = mean(m$Handwash, na.rm = T), col = 'red', lwd = 5)
The histogram organizes the data, but you can see the same patterns in both graphs. The Mean = 3.4148148
par(mfrow = c(1,2))
plot(m$Handwash, ylab = "Handwashing Behavior")
abline(h = mean(m$Handwash, na.rm = T), col = 'red', lwd = 5)
hist(m$Handwash, xlab = "Handwashing Behavior", main = "")
abline(v = mean(m$Handwash, na.rm = T), col = 'red', lwd = 5)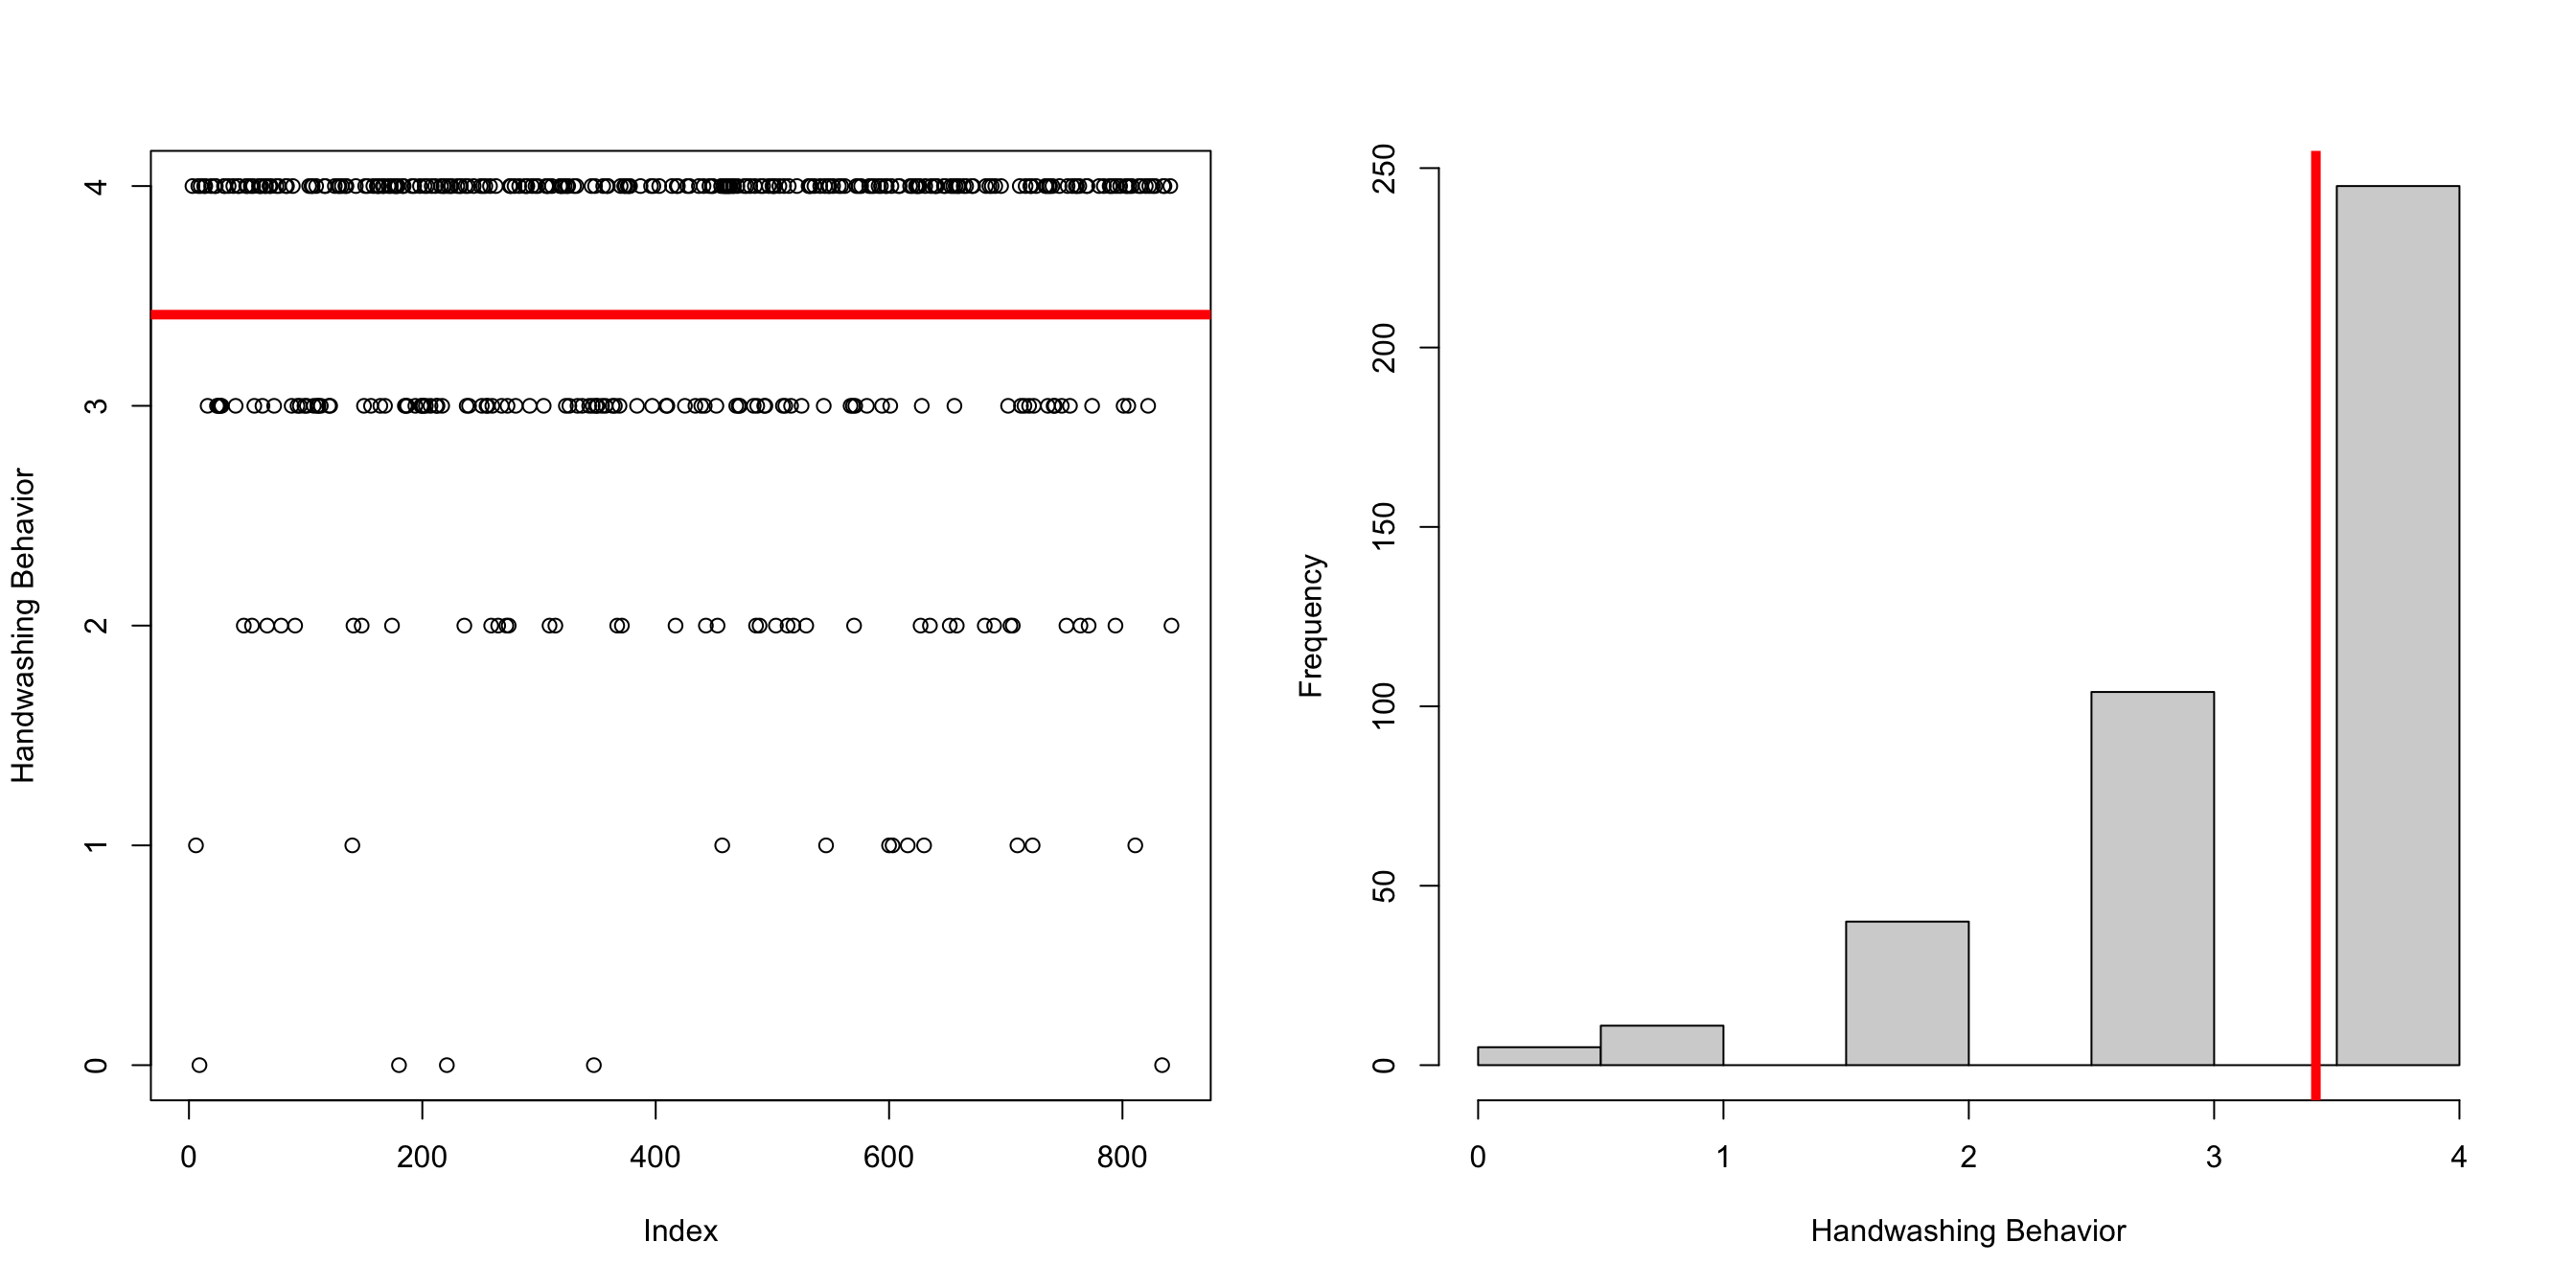
plot(m$Handwash, ylab = "Handwashing Behavior")
abline(h = mean(m$Handwash, na.rm = T), col = 'red', lwd = 5)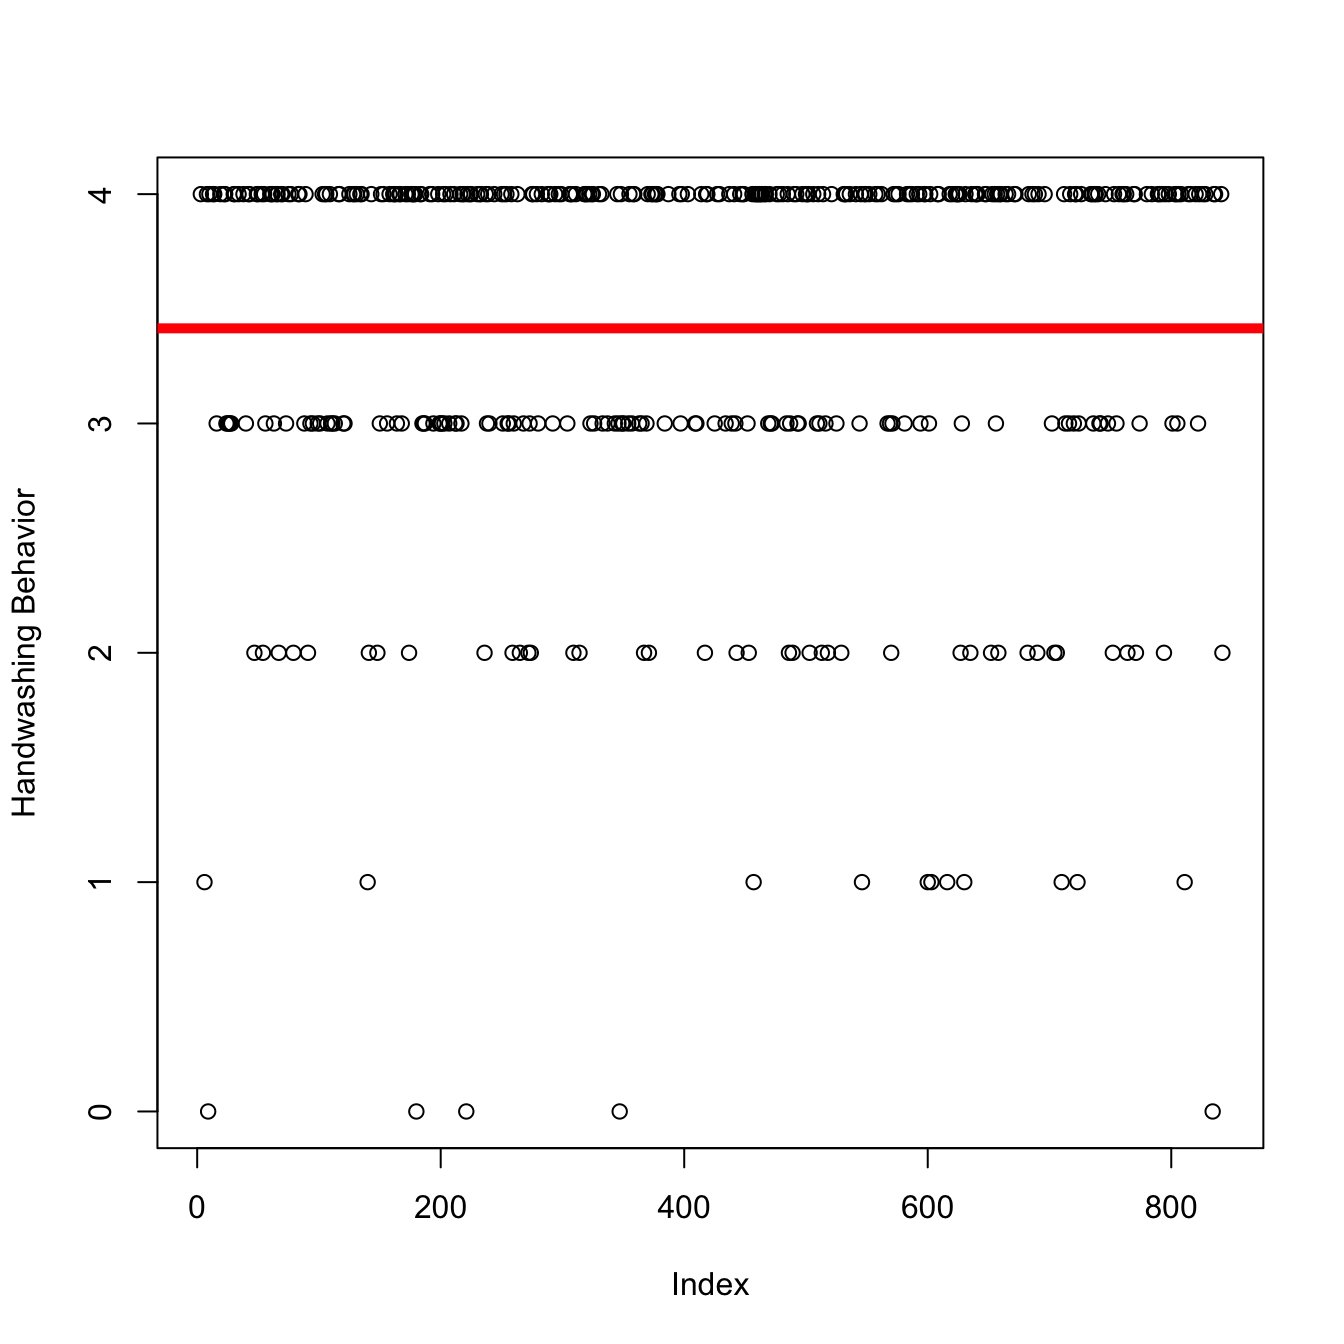
\[ \Huge y_i = \bar{Y} + \epsilon_i \]
World Happiness Report Dataset
change the dataset name : something short!
check the headers : do the variables have the correct names?
stringAsFactors = T : make sure that string data are converted to categorical data
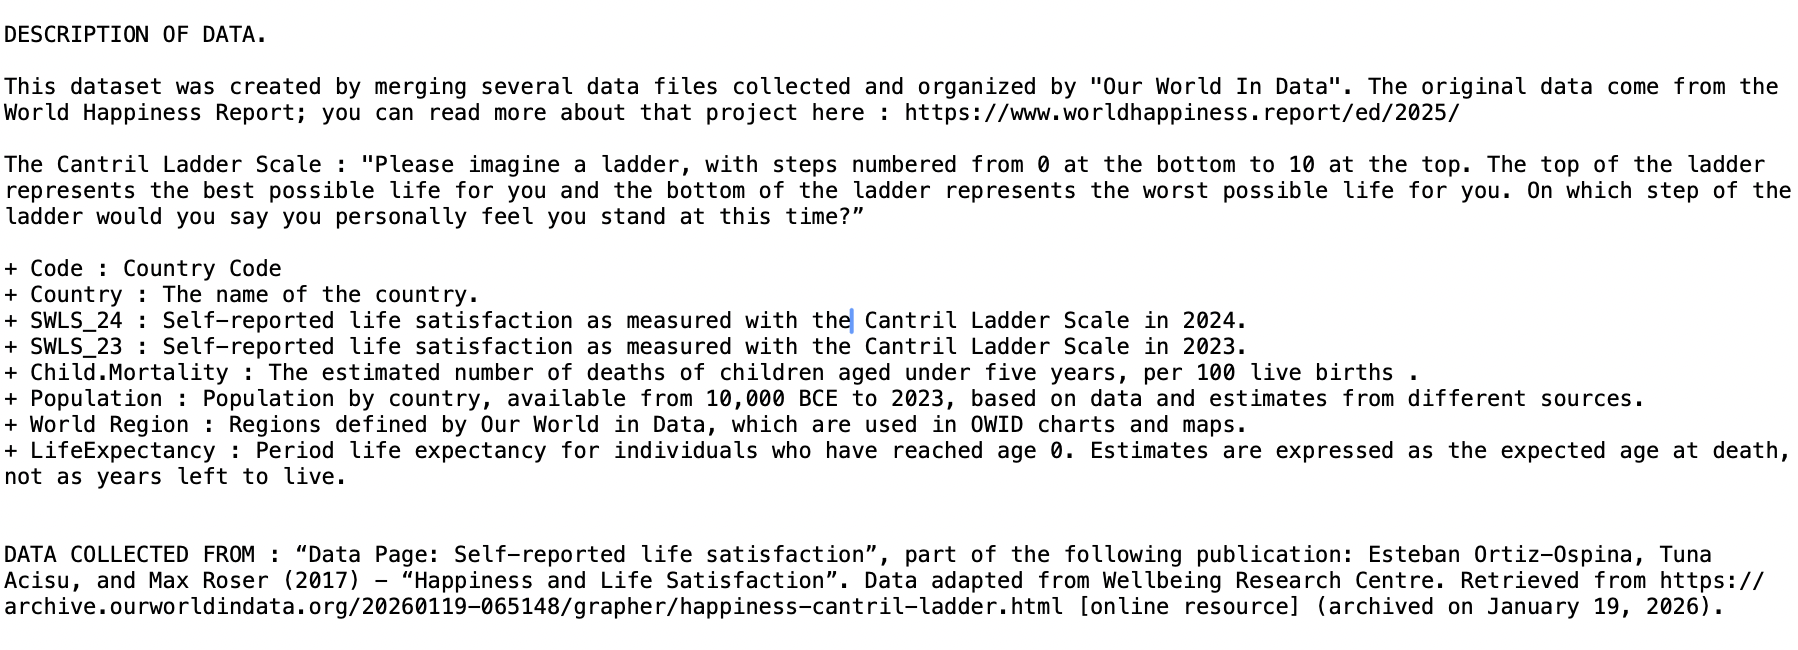
Download the “World Happiness” data, and import this data into R. We’ll be focusing on .

In Small Groups: Graph a numeric variable from the World Happiness Dataset, run descriptive statistics (mean, median, range, standard deviation), and describe what these statistics tell you about the data in the graph. What do you learn about this variable? What other questions about this variable do you have?