Chapter 2 | Working with Data
Check-In, Agenda, and Announcements
Welcome Back!
Access this Document Here : catterson.github.io/calstats/calstatsSP26.html

Check-In Review
Florence Nightingale
- Did you learn about Florence Nightingale in other classes? [Clap : Yes / No]
- What did you remember learning about Florence Nightingale in other classes?
Class Discussion.
- Ice Breaker : What’s your favorite way to feel better when sick?
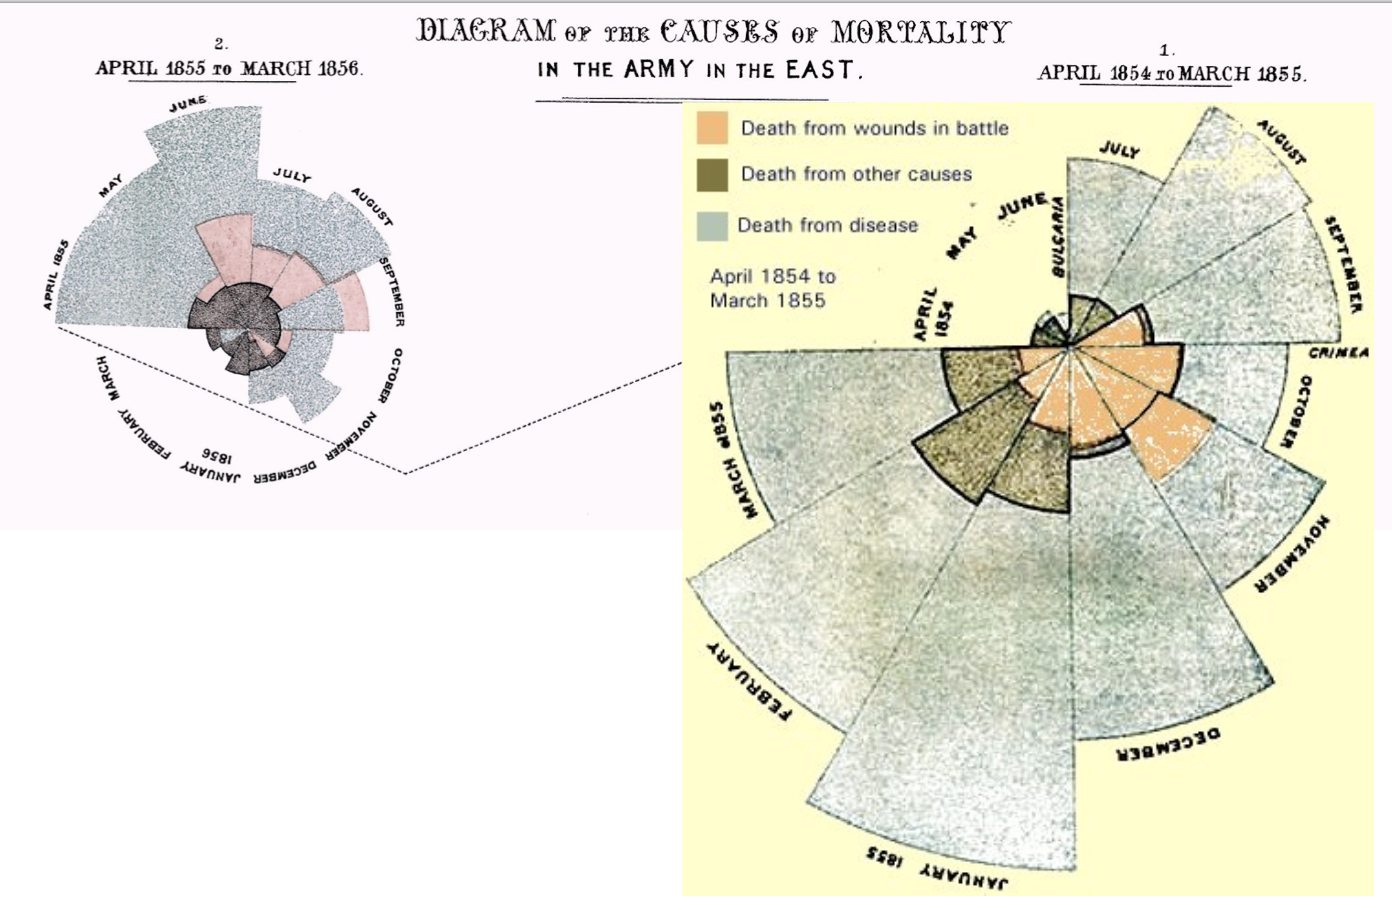
- What’s going on in this graph / who cares / how can we use this knowledge??
- What variables are in the graph? How would you organize them as a linear model?
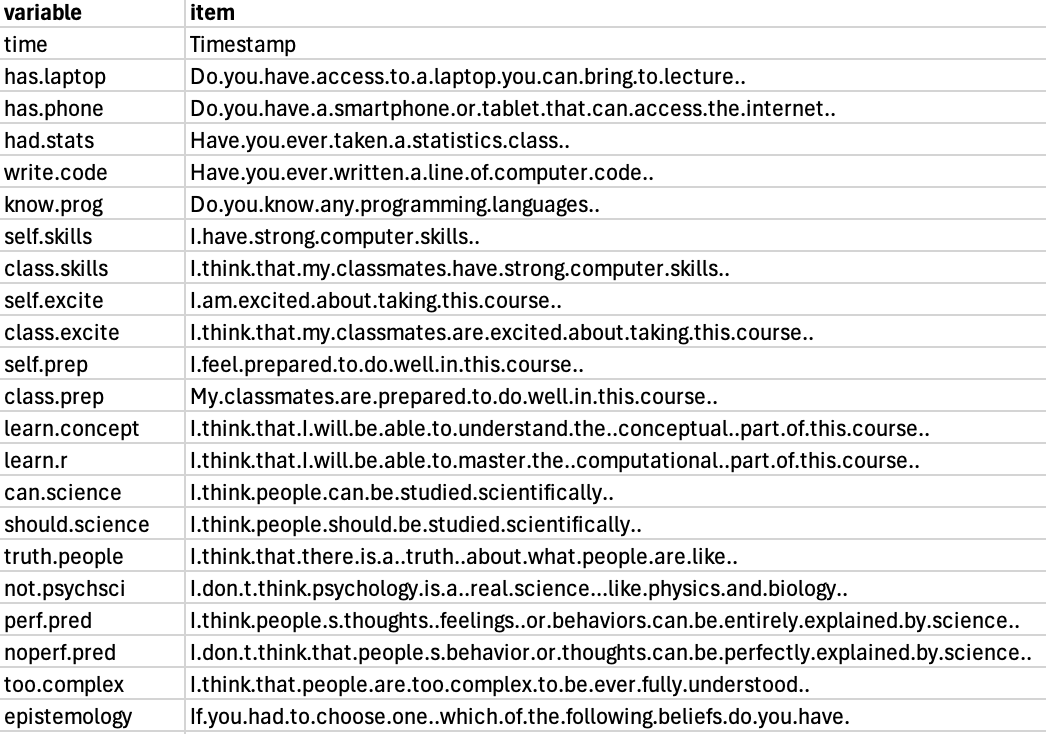
THE CODEBOOK : Onboarding Survey
Look over the codebook –>
- What is one variable from the dataset that is interesting to you (if any)?
- Is this categorical or numeric data?
- What predictions do you have about what this variable will look like?
- How might we use knowledge of this variable?
BREAK TIME : MEET BACK AT ______ !!!!

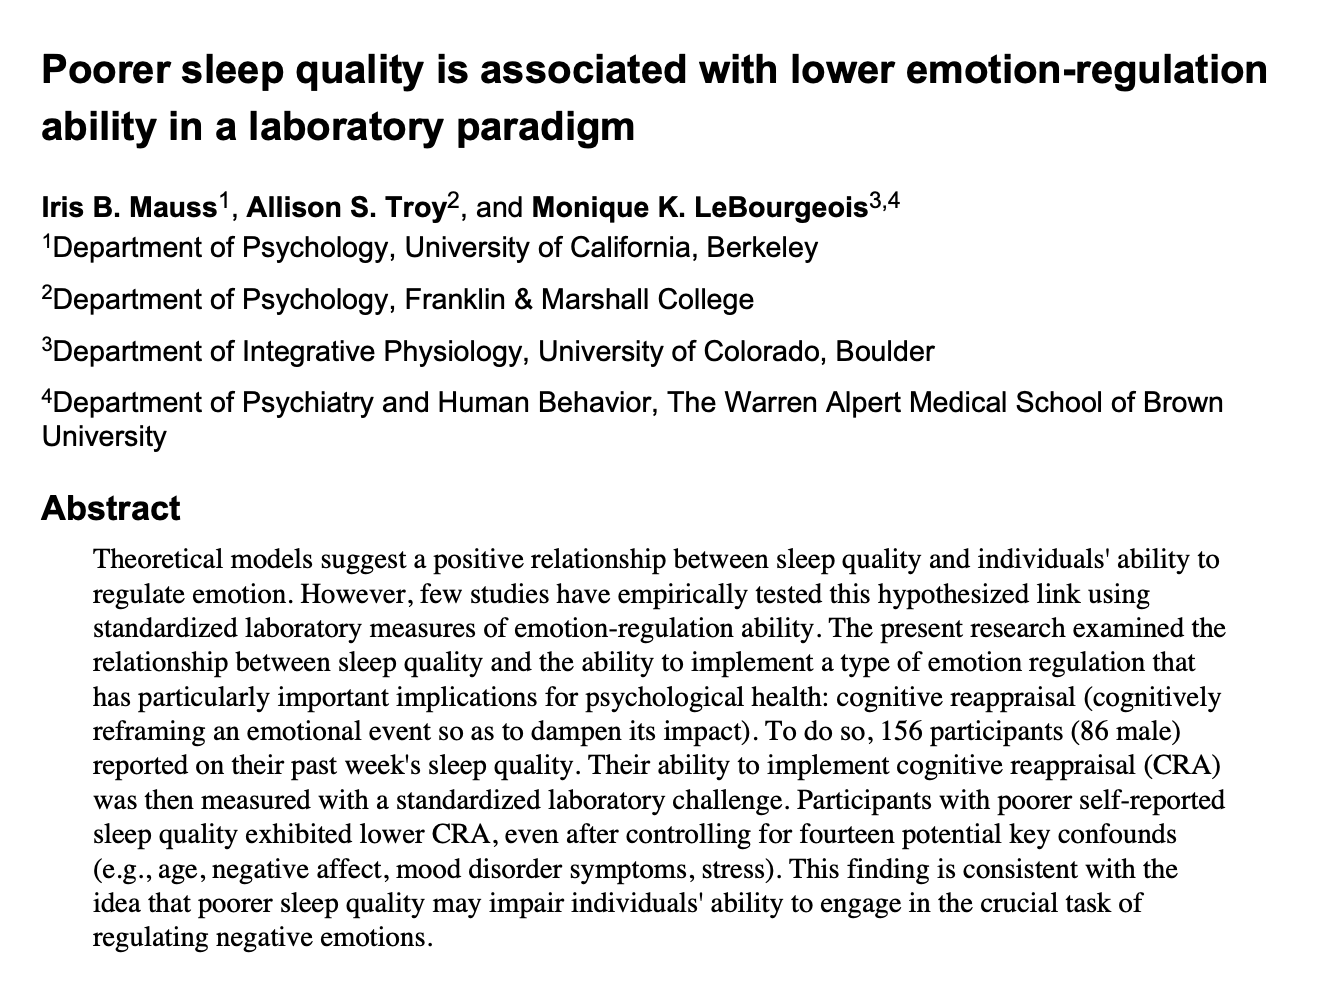
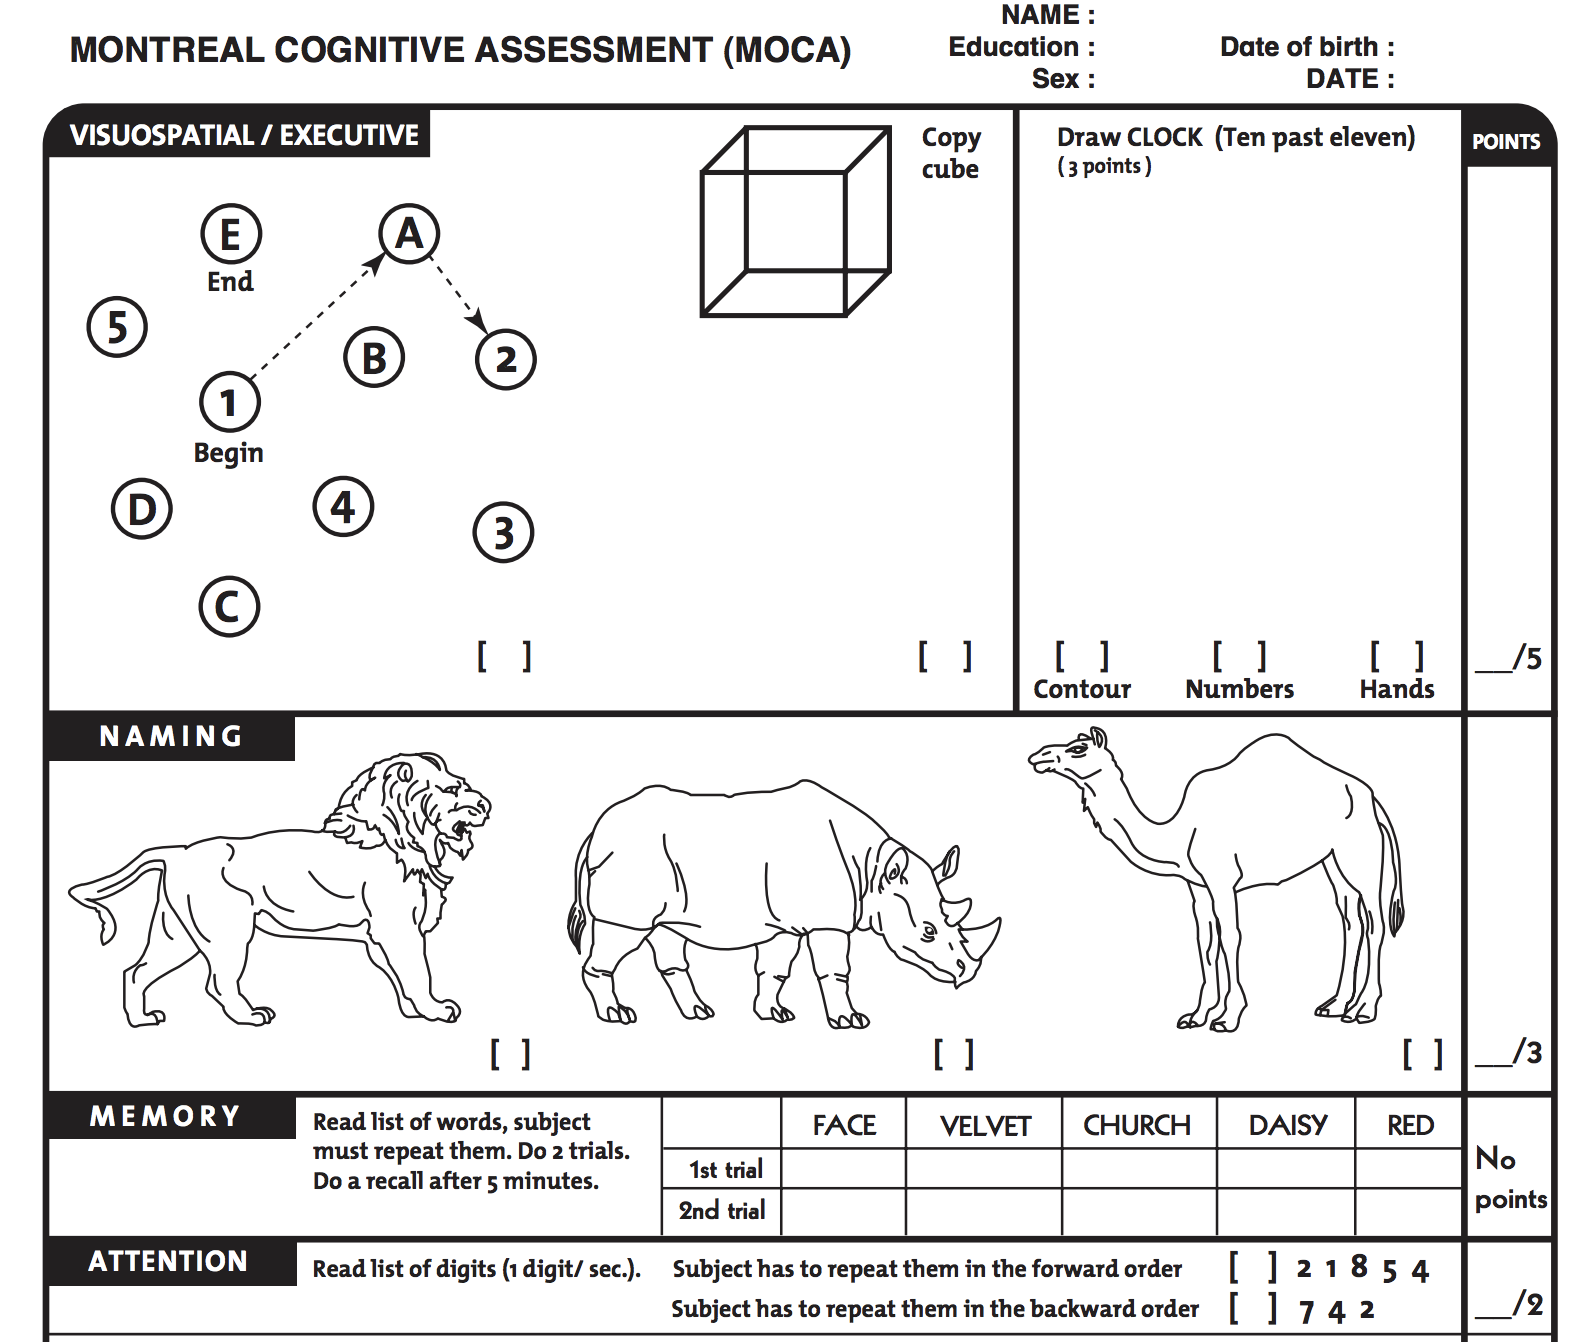
ACED the “Cognitive Examination”
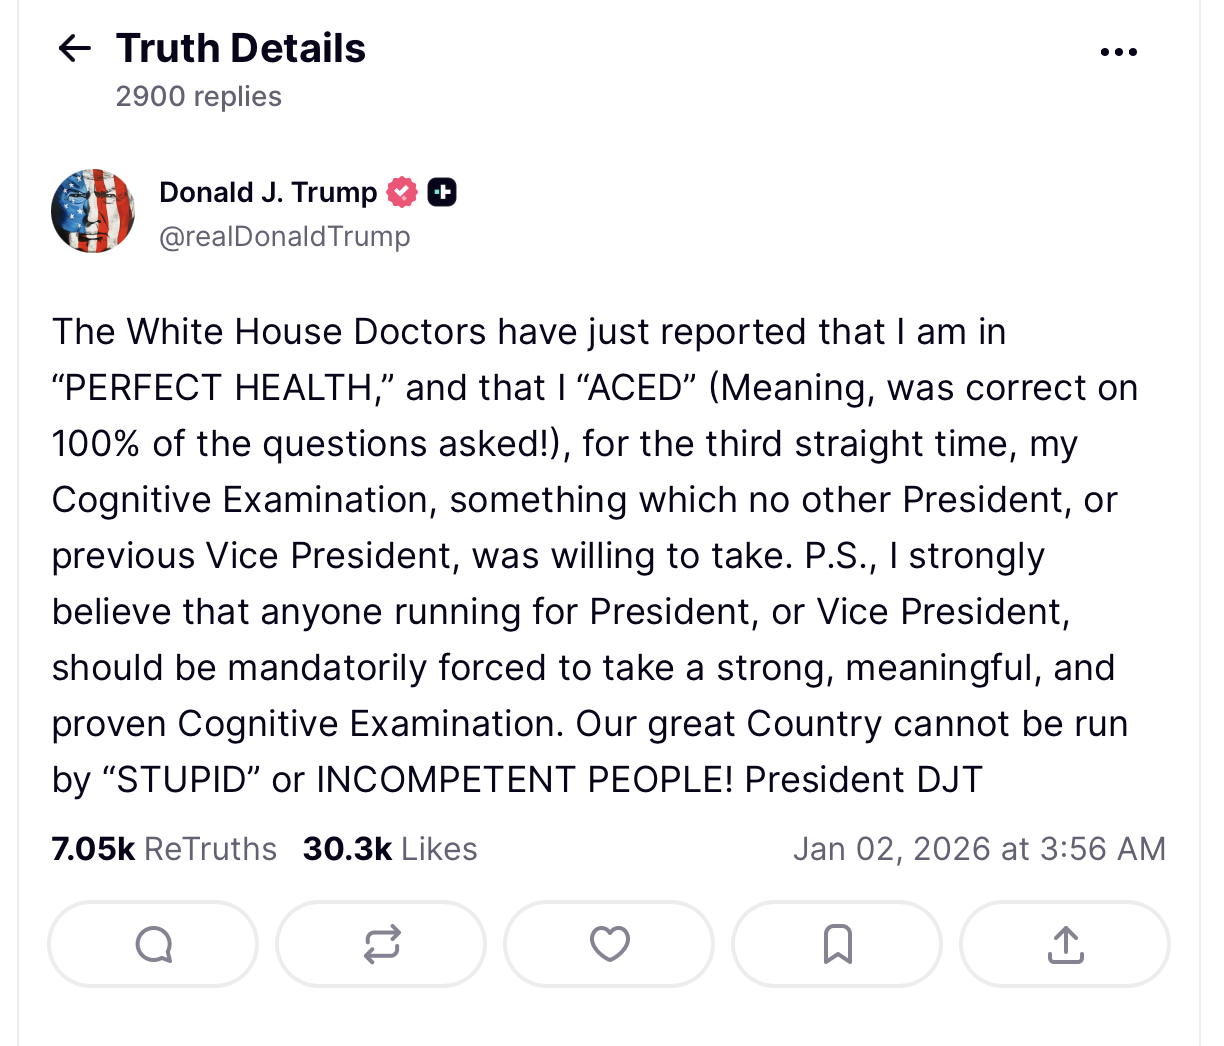
The Scientific Operationalization of the Cognitive Examination
BYE BYE : FOR NEXT WEEK
