d <- read.csv("~/Dropbox/!WHY STATS/Class Datasets/101 - Class Datasets/Mini Data/mini_DATA.csv", stringsAsFactors = T)
library(plotly) # you will need to install this.
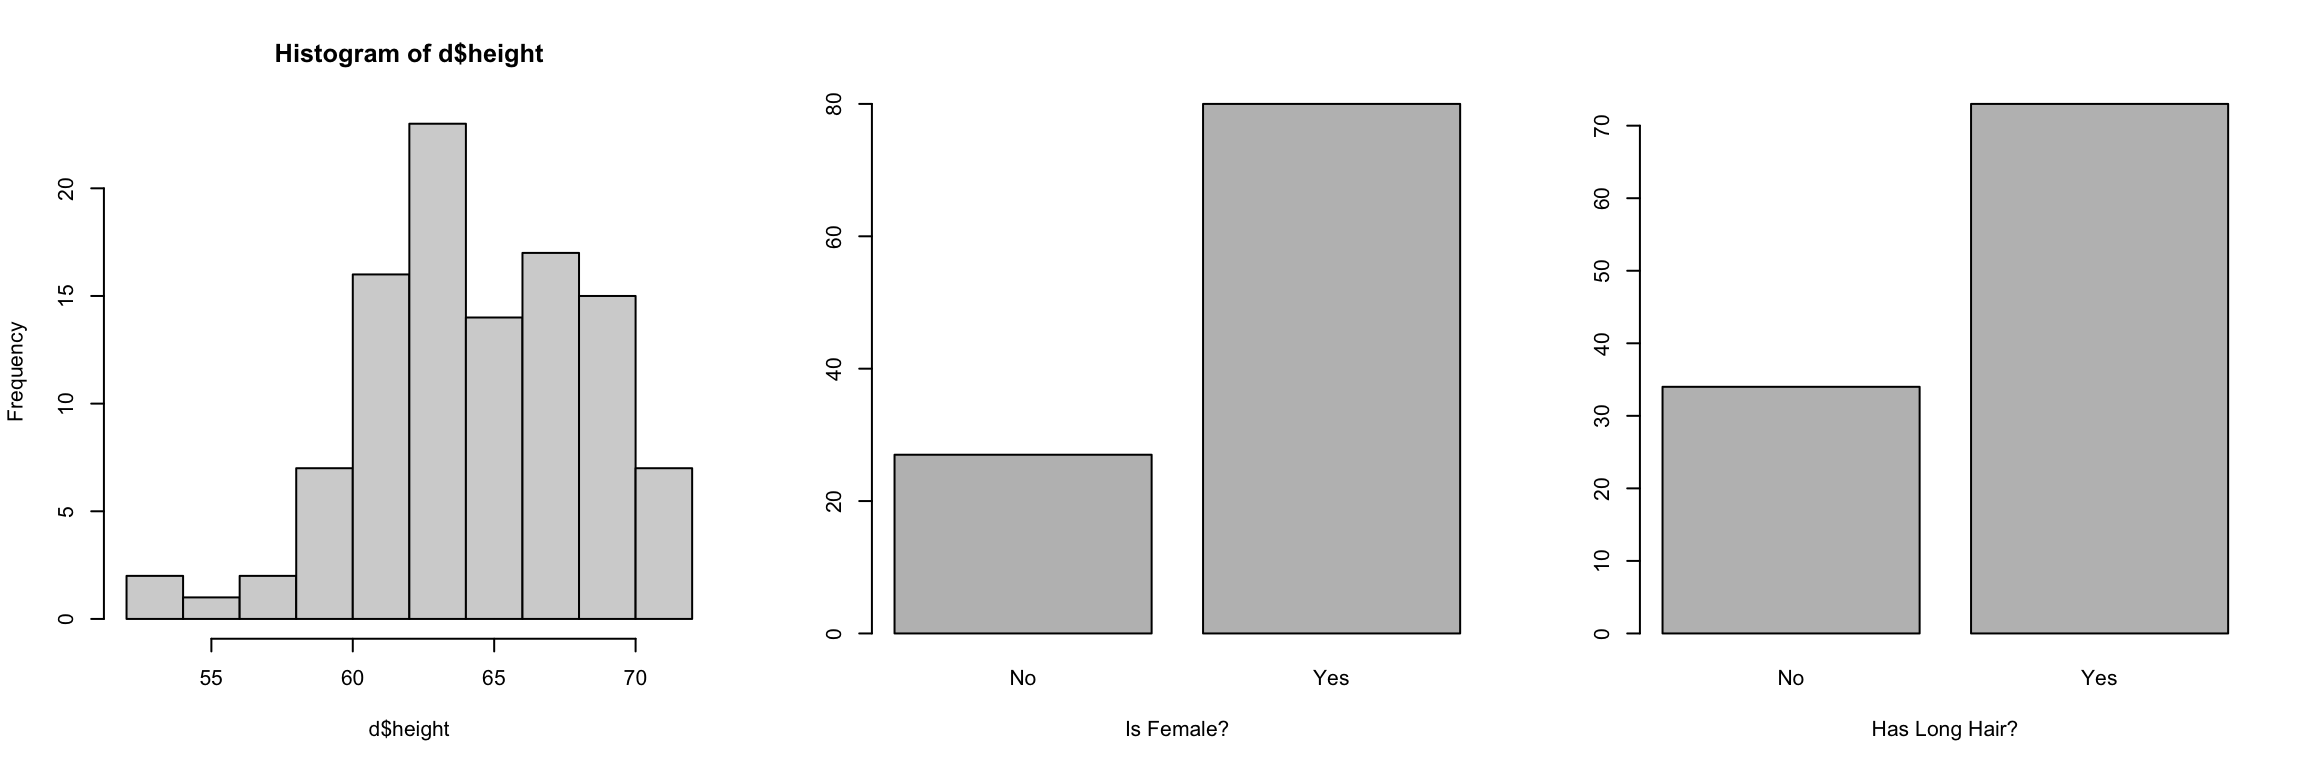
d$height[d$height < 10 | d$height > 100] <- NA
levels(d$is.female)[1] <- NA
levels(d$long.hair)[1] <- NA
# PROF used AI (gemini) to generate this code.
##### I used to use the function scatter3d from the "car" library
##### ....but it stopped working.
# Create the interactive 3D scatter plot
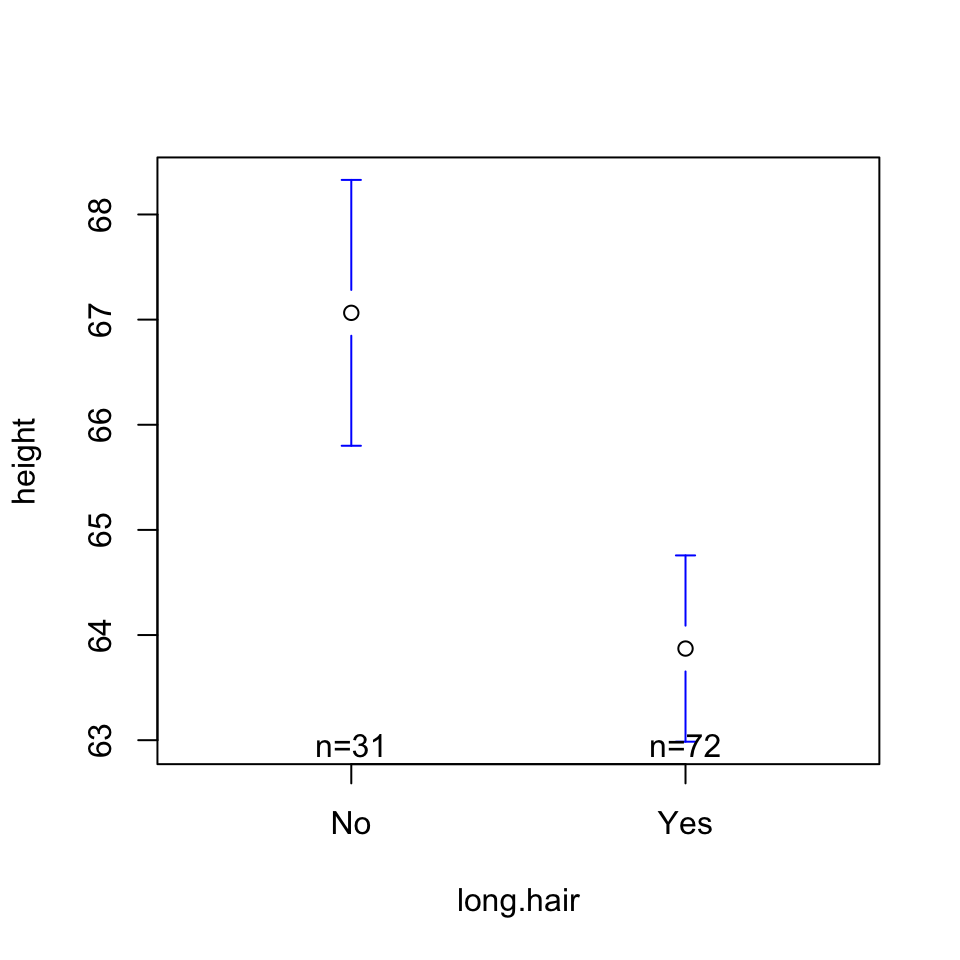
model <- lm(height ~ long.hair + is.female, data = d)
plot_ly(data = d,
x = ~long.hair,
y = ~is.female,
z = ~height,
type = "scatter3d",
mode = "markers",
marker = list(size = 5, opacity = 0.8)) %>%
layout(scene = list(xaxis = list(title = 'Hair Length'),
yaxis = list(title = 'Is Female'),
zaxis = list(title = 'Height')))
hair_levels <- levels(d$long.hair)
levels(hair_levels)
gender_levels <- levels(d$is.female)
# Create a grid for all combinations
grid <- expand.grid(long.hair = hair_levels,
is.female = gender_levels)
# 3. Predict height across the grid and format as a matrix
z_matrix <- matrix(predict(model, newdata = grid),
nrow = length(hair_levels),
ncol = length(gender_levels))
# 4. Create the plot
plot_ly(d, x = ~long.hair, y = ~is.female, z = ~height) %>%
add_markers(marker = list(size = 3, opacity = 0.6)) %>%
add_surface(x = hair_levels,
y = gender_levels,
z = t(z_matrix), # Transpose to align with axes
opacity = 0.7,
showscale = FALSE) %>%
layout(scene = list(xaxis = list(title = 'Hair Length'),
yaxis = list(title = 'Is Female'),
zaxis = list(title = 'Height')))