Lab8_102
Problem 1. Describe & Visualize Your Project Data
All of y’all who took the check-in last week reported having SOME kind of dataset that you think would work for the final project. Hooray! So now it’s time
- Describe your final project data to someone who is moderately interested, but probably has their own life and needs and wants and is also very tired and maybe hungry. What’s the question that you have? Why do you care about this topic? (Why should we?)
- Describe a few of the variables in your study. Make a graph of the variables, and report the descriptive statistics that you need to understand what’s going on with the data.
- Plan your analyses. Okay
Problem 2. Making a Nice Report using Quarto.
Cool that you did all these analyses! But, sadly, no one wants to read all that R code and maybe you are getting tired of taking screenshots.
Use Quarto to condense your report for down into a 1-page document that you might show to an busy and somewhat-interested advisor, friend, romantic partner, or cryptocurrency billionaire trust-fund kid looking to invest some of their “fun money” in your project.
Professor demonstrated how to use Quarto in class because he put this first on the agenda. But lots of other resources exist in the world! Here are a few that professor uses :
The official quarto tutorial. There’s a YouTube video and everything.
The authoring guide. It feels like I have this perpetually open on my computer.
From R for Data Science. For those who don’t like YouTube videos or official documentation.
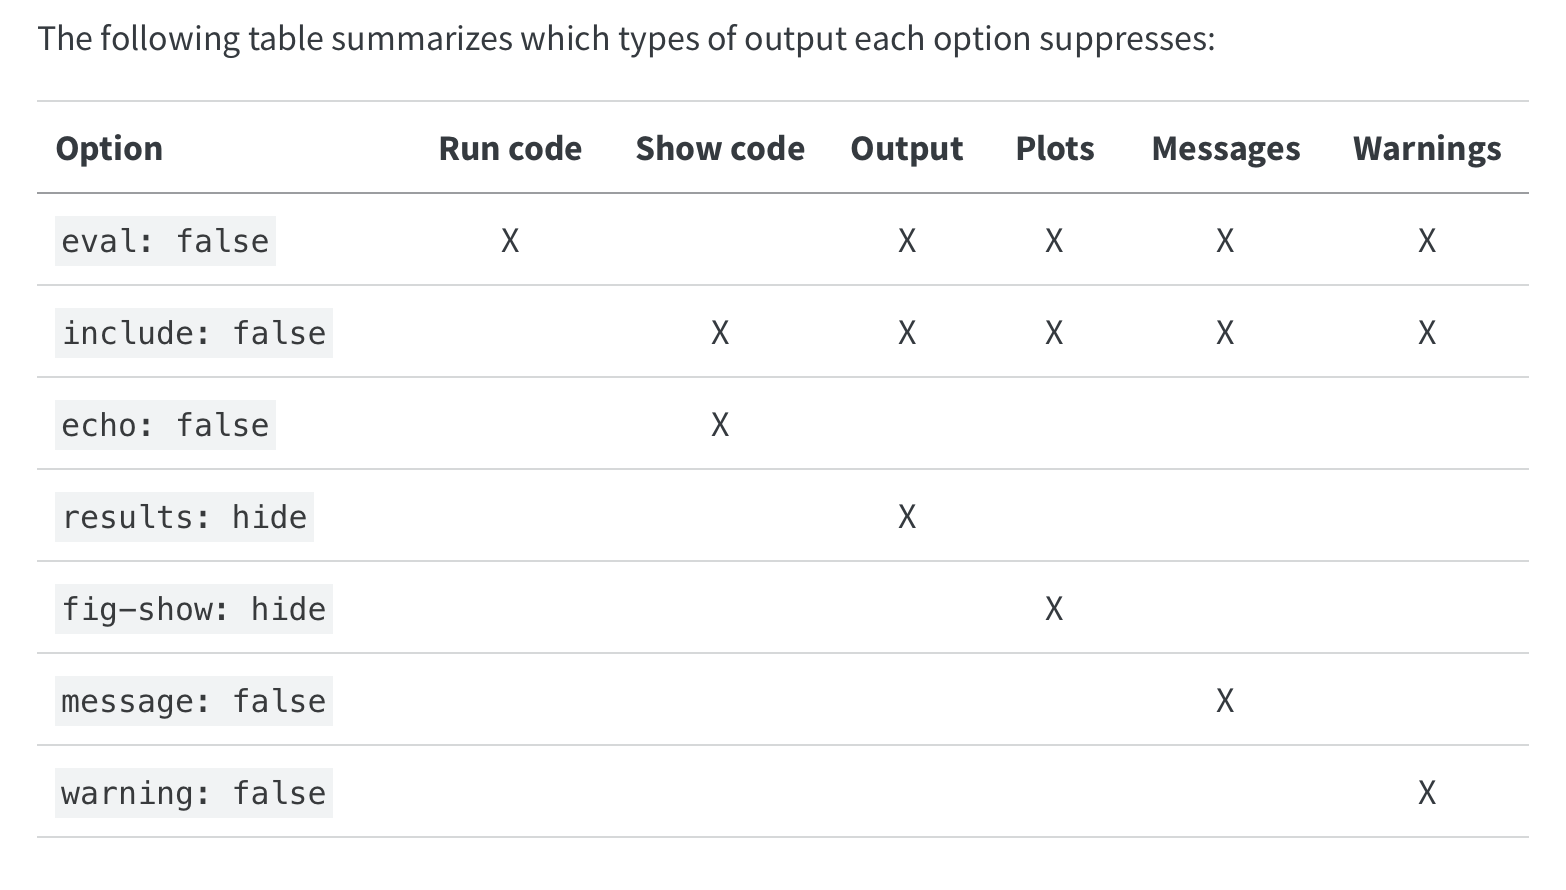
The Quarto document should contain the code that you use to a) load the data (and libraries that you need) and b) execute the analyses to report the statistics. However, your readers probably do not need to see ALL of this code. So experiment / play around with making the code blocks visible for the viewer, and think about what information is most necessary for your audience to see in order to understand your results. Here’s a helpful table on this :)
Render the .qmd file as a PDF (or render as HTML, and then save this page as a PDF…honestly this is easier and looks better.)
When you are done, upload the PDF to the assignment on bCourses. We will go over a few examples next week - okay if this is messy; we are learning!
Problem 3. Quarto is Fun. We are Having Fun.
Note : Quarto is super flexible - lots of ways to use. I made my humble webpage in Quarto (hosted by github pages, but you can host on other platforms as well), and the lil’ stats textbook for my 101 class in Quarto, and this Lab Document in Quarto. So for this last problem, play around with Quarto, and upload something you think is neat (either a link to a helpful resource, or a screenshot of something you did, or maybe a link to your own website that now exists in the world) to the class Discord page. We are making Discord happen.
Problem 4. Professor Wants You To Read All That.
Read or skim Chapter 11 on Interaction Effects. Post on Discord in the thread - is there an interaction effect you might want to test in your final project data? What pattern might you find (sketch it out or describe it..you don’t need to run it yet.) Do you have any questions / did you find anything that was confusing in the chapter / find a cool resource that helps us learn about interaction effects? Yes, Discord is happening. We did it.